Mathematics, 26.04.2021 15:10 juliannasl
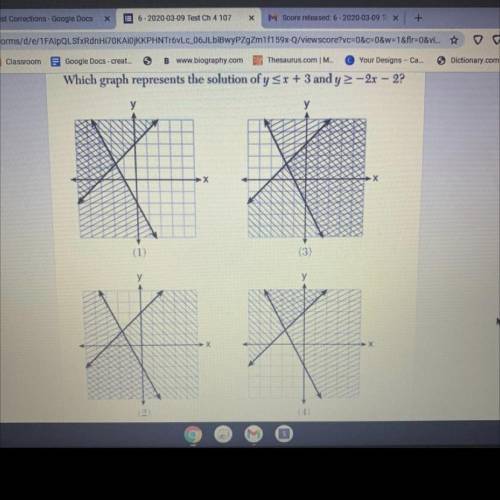
Which graph represents the solution of y <_ x + 3 and y >_ -2x - 2? Please show work


Answers: 2


Another question on Mathematics

Mathematics, 21.06.2019 19:00
Through non-collinear points there is exactly one plane.
Answers: 1

Mathematics, 22.06.2019 00:30
Efficient homemakers ltd. makes canvas wallets and leather wallets as part of a money-making project. for the canvas wallets, they need two yards of canvas and two yards of leather. for the leather wallets, they need four yards of leather and three yards of canvas. their production unit has purchased 44 yards of leather and 40 yards of canvas. let x be the number of leather wallets and y be the number of canvas wallets. draw the graph showing the feasible region to represent the number of the leather and canvas wallets that can be produced.
Answers: 1

Mathematics, 22.06.2019 04:30
When 60% of a number is added to the number the result is 192 what is the bumber
Answers: 1

Mathematics, 22.06.2019 04:40
Could these triangles be congruent? yes, if ab - deyes, if bc = 7yes, if ab - efno, because the hypotenuses must have different lengths
Answers: 1
You know the right answer?
Which graph represents the solution of y <_ x + 3 and y >_ -2x - 2? Please show work
...
...
Questions


Mathematics, 16.01.2020 06:31


History, 16.01.2020 06:31

Computers and Technology, 16.01.2020 06:31

Health, 16.01.2020 06:31


Mathematics, 16.01.2020 06:31


Physics, 16.01.2020 06:31

Mathematics, 16.01.2020 06:31


Mathematics, 16.01.2020 06:31


Spanish, 16.01.2020 06:31


