The scatter plot shows the
sale price of several food
items, y, and the cost of
the in...

Mathematics, 26.04.2021 20:50 natalie2sheffield
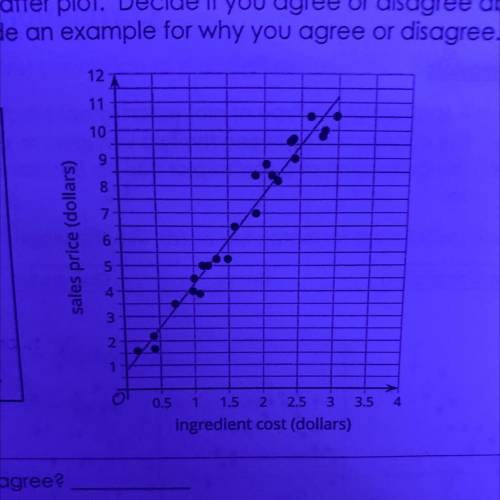
The scatter plot shows the
sale price of several food
items, y, and the cost of
the ingredients used to
produce those items, x, as
well as a line that models
the data. The line is also
represented by the
equation y = 3.48x + 0.76.
The predicted sale prince of an item that has ingredients that cost $1.50 is $5.25
Agree or disagree?
Explain:

Answers: 3


Another question on Mathematics
Mathematics, 21.06.2019 15:30
Is each relation a function? if so, state whether it is one-to-one or many-to-one. 3. (-4,7), (-3,5), (1,4), (3,-8), (5,-11) 4. (-4,8), (-2,4), (0,1), (2,4), (4,8) 5. (-2, 1), (-2,3), (0,-3), (1,4), (3,1)
Answers: 3
Mathematics, 21.06.2019 20:40
The roots of the function f(x) = x2 – 2x – 3 are shown. what is the missing number?
Answers: 2
Mathematics, 21.06.2019 23:00
Sara made $253 for 11 hours of work. at the same rate how much would he make for 7 hours of work?
Answers: 2
Mathematics, 22.06.2019 05:30
To increase her number of students, the instructor put a coupon in the local paper offering to waive the one-time fee for new students. what is the value of the coupon?
Answers: 1
You know the right answer?
Questions


Computers and Technology, 03.09.2019 03:30

Computers and Technology, 03.09.2019 03:30


Computers and Technology, 03.09.2019 03:30
Medicine, 03.09.2019 03:30


