Use a table of values to graph the following functions.
Sate the domain and range.
1. y= x^2...

Mathematics, 27.04.2021 04:20 louie8656
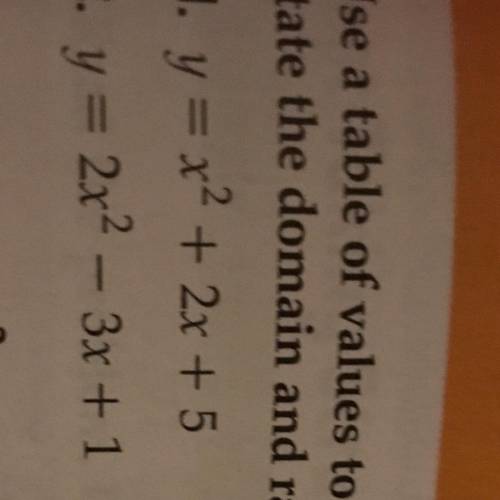
Use a table of values to graph the following functions.
Sate the domain and range.
1. y= x^2 + 2x + 5
2. y = 2x^2 - 3x + 1

Answers: 2


Another question on Mathematics
Mathematics, 21.06.2019 18:00
Agraph of a trapezoid can have diagonals with slopes that are negative reciprocals and two pairs of adjacent sides that are congruent, true or false, and why
Answers: 1
Mathematics, 21.06.2019 18:00
George has seven boxes of five pencils. giulio three boxes of eight pencils. one of the boys arranges all his pencils equally into two groups. was this george or giulio how many are in each group explain
Answers: 1
Mathematics, 21.06.2019 20:00
The boiling point of water at an elevation of 0 feet is 212 degrees fahrenheit (°f). for every 1,000 feet of increase in elevation, the boiling point of water decreases by about 2°f. which of the following represents this relationship if b is the boiling point of water at an elevation of e thousand feet? a) e = 2b - 212 b) b = 2e - 212 c) e = -2b + 212 d) b = -2e + 212
Answers: 1
Mathematics, 21.06.2019 20:20
Select the correct answer from each drop-down menu. the length of a rectangle is 5 inches more than its width. the area of the rectangle is 50 square inches. the quadratic equation that represents this situation is the length of the rectangle is inches.
Answers: 1
You know the right answer?
Questions
Mathematics, 14.12.2021 19:40

History, 14.12.2021 19:40

Mathematics, 14.12.2021 19:40

Social Studies, 14.12.2021 19:40
Mathematics, 14.12.2021 19:40
Mathematics, 14.12.2021 19:40
History, 14.12.2021 19:40

Biology, 14.12.2021 19:40

Computers and Technology, 14.12.2021 19:40


