
Mathematics, 27.04.2021 07:20 tedrayoung1
Consider the following graph, which details the population of a city over time. A line graph titled Population (thousands) has year on the x-axis and number on the y-axis. The points are connected by a line that gradually increases. What aspect of the graph is likely being emphasized by the choice of graph style, choice of scale, and so on? a. the sharp differences between individual data points b. the disjoint nature of the data collected c. the strong distinction between each year’s data d. the extended, continual growth of the population

Answers: 3


Another question on Mathematics
Mathematics, 21.06.2019 19:00
How is working backward similar to solving an equation?
Answers: 1
Mathematics, 21.06.2019 20:30
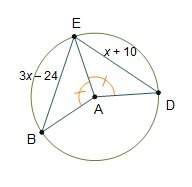
Secant ac and bd intersect at point e inside f what is the measure of aed if measurements cd equals 30 a b is 50 and cb is 170
Answers: 1
Mathematics, 21.06.2019 21:30
Aboard 60 in. long is cut two parts so that the longer piece is 5 times the shorter. what are the length of the two pieces?
Answers: 1
You know the right answer?
Consider the following graph, which details the population of a city over time. A line graph titled...
Questions
Mathematics, 21.10.2020 01:01

History, 21.10.2020 01:01
Mathematics, 21.10.2020 01:01
Mathematics, 21.10.2020 01:01

Biology, 21.10.2020 01:01

Mathematics, 21.10.2020 01:01
Mathematics, 21.10.2020 01:01
Biology, 21.10.2020 01:01

Chemistry, 21.10.2020 01:01
Mathematics, 21.10.2020 01:01


