
Mathematics, 27.04.2021 08:30 persondontknowhelp
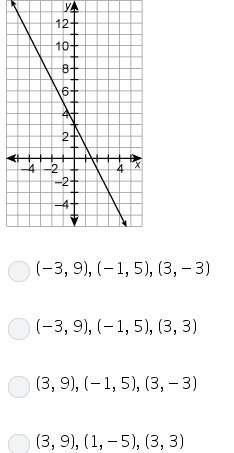
The graph shows the distance in miles, d, a car travels in hours. Explain why the graph does or does not represent a proportional relationship between the variables d and t.

Answers: 3


Another question on Mathematics
Mathematics, 21.06.2019 14:00
What is the slope of a line that is perpendicular to y = 3x + 1
Answers: 1
Mathematics, 21.06.2019 18:50
The number of fish in a lake can be modeled by the exponential regression equation y=14.08 x 2.08^x where x represents the year
Answers: 3
Mathematics, 21.06.2019 19:00
Solve the equation using the zero-product property. -3n(7n - 5) = 0 a. 0, -5/7 b. -1/3, -5/7 c. -1/3, 5/7 d. 0, 5/7
Answers: 2
Mathematics, 21.06.2019 20:00
Someone answer asap for ! max recorded the heights of 500 male humans. he found that the heights were normally distributed around a mean of 177 centimeters. which statements about max’s data must be true? a. the median of max’s data is 250 b. more than half of the data points max recorded were 177 centimeters. c. a data point chosen at random is as likely to be above the mean as it is to be below the mean. d. every height within three standard deviations of the mean is equally likely to be chosen if a data point is selected at random.
Answers: 1
You know the right answer?
The graph shows the distance in miles, d, a car travels in hours. Explain why the graph does or...
Questions

English, 02.09.2020 04:01
Mathematics, 02.09.2020 04:01


Geography, 02.09.2020 04:01


Mathematics, 02.09.2020 04:01
Chemistry, 02.09.2020 04:01
Mathematics, 02.09.2020 04:01
English, 02.09.2020 04:01


