
Mathematics, 27.04.2021 14:00 ritahastie2896
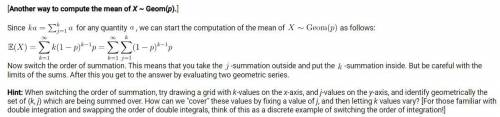
Since ka = summation of α from j=1 to k for any quantity α, we can start the computation of the mean of X...

Answers: 2


Another question on Mathematics
Mathematics, 21.06.2019 21:20
Rose bought a new hat when she was on vacation. the following formula describes the percent sales tax rose paid b=t-c/c
Answers: 3
Mathematics, 21.06.2019 23:00
Graph the system of equations on your graph paper to answer the question. {y=−x+4y=x−2 what is the solution for the system of equations? enter your answer in the boxes.
Answers: 1
Mathematics, 22.06.2019 00:30
I've been working on this for a few days and i just don't understand, it's due in a few hours. you. the direction of a vector is defined as the angle of the vector in relation to a horizontal line. as a standard, this angle is measured counterclockwise from the positive x-axis. the direction or angle of v in the diagram is α. part a: how can you use trigonometric ratios to calculate the direction α of a general vector v = < x, y> similar to the diagram? part b suppose that vector v lies in quadrant ii, quadrant iii, or quadrant iv. how can you use trigonometric ratios to calculate the direction (i.e., angle) of the vector in each of these quadrants with respect to the positive x-axis? the angle between the vector and the positive x-axis will be greater than 90 degrees in each case. part c now try a numerical problem. what is the direction of the vector w = < -1, 6 > ?
Answers: 1
Mathematics, 22.06.2019 01:00
The weight of 46 new patients of a clinic from the year 2018 are recorded and listed below. construct a frequency distribution, using 7 classes. then, draw a histogram, a frequency polygon, and an ogive for the data, using the relative information from the frequency table for each of the graphs. describe the shape of the histogram. data set: 130 192 145 97 100 122 210 132 107 95 210 128 193 208 118 196 130 178 187 240 90 126 98 194 115 212 110 225 187 133 220 218 110 104 201 120 183 124 261 270 108 160 203 210 191 180 1) complete the frequency distribution table below (add as many rows as needed): - class limits - class boundaries - midpoint - frequency - cumulative frequency 2) histogram 3) frequency polygon 4) ogive
Answers: 1
You know the right answer?
Since ka = summation of α from j=1 to k for any quantity α, we can start the computation of the mean...
Questions
Mathematics, 14.12.2020 18:10

History, 14.12.2020 18:10
Mathematics, 14.12.2020 18:10

Mathematics, 14.12.2020 18:10
Mathematics, 14.12.2020 18:10
Mathematics, 14.12.2020 18:10

Mathematics, 14.12.2020 18:10
History, 14.12.2020 18:10

Computers and Technology, 14.12.2020 18:10

Mathematics, 14.12.2020 18:10
History, 14.12.2020 18:10
English, 14.12.2020 18:10
Mathematics, 14.12.2020 18:10


