
Mathematics, 27.04.2021 18:10 dashavasilisk
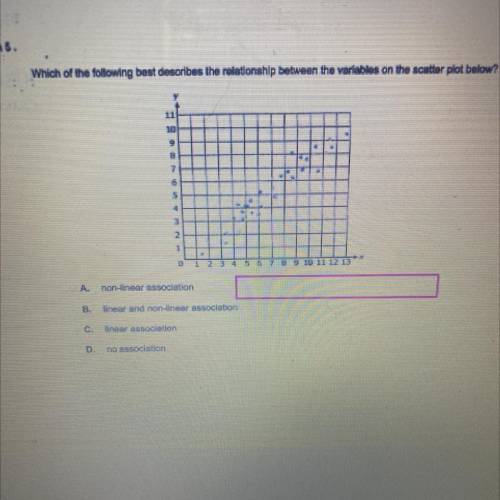
Which of the following best describes the relationship between the variables on the scatter plot below?
8
7
6
0 1 2 3 4 5 6 7 8 9 10 11 12 13
A non-linear association
B. linear and non-linear association
C. linear association
no association

Answers: 3


Another question on Mathematics
Mathematics, 21.06.2019 18:00
Solve this equation using substitution. {4x + y = −2} {4x + 6y = 44}
Answers: 1
Mathematics, 21.06.2019 18:50
Which of the following values cannot be probabilities? 0.08, 5 divided by 3, startroot 2 endroot, negative 0.59, 1, 0, 1.44, 3 divided by 5 select all the values that cannot be probabilities. a. five thirds b. 1.44 c. 1 d. startroot 2 endroot e. three fifths f. 0.08 g. 0 h. negative 0.59
Answers: 2
Mathematics, 21.06.2019 19:10
Which situation can be modeled by the inequality 5 + 10w ≥ 45? a. you start with $5 and save $10 a week until you have at least $45. b.you start with 5 baseball cards and purchase 10 cards every week until you have at most 45 cards. c.you start with 5 water bottles and purchases cases of 10 water bottles each until you have a total of 45 water bottles. d.you spend $5 plus $10 per week until you have less than $45.
Answers: 3
You know the right answer?
Which of the following best describes the relationship between the variables on the scatter plot bel...
Questions


Mathematics, 16.11.2020 05:40

English, 16.11.2020 05:40

Biology, 16.11.2020 05:40
Mathematics, 16.11.2020 05:40
Mathematics, 16.11.2020 05:40

Social Studies, 16.11.2020 05:40
Mathematics, 16.11.2020 05:40
Mathematics, 16.11.2020 05:40
English, 16.11.2020 05:40

English, 16.11.2020 05:40
Mathematics, 16.11.2020 05:40
Social Studies, 16.11.2020 05:40
Mathematics, 16.11.2020 05:40
Mathematics, 16.11.2020 05:40


