Mathematics, 28.04.2021 20:10 yyyyyyyyy8938
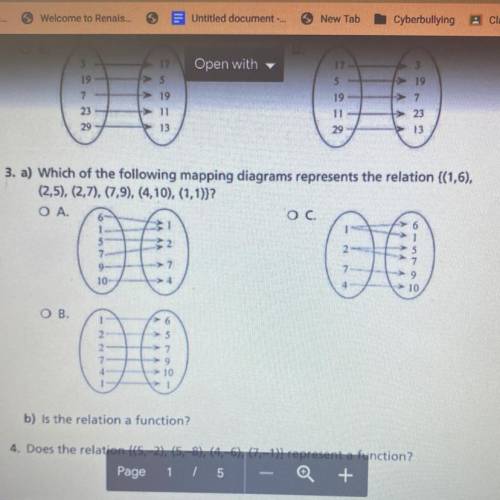
3. a) Which of the following mapping diagrams represents the relation {(1,6),
(2,5), (2,7), (7,9), (4,10), (1,1))?
b) is the relation a function?


Answers: 3


Another question on Mathematics

Mathematics, 21.06.2019 17:30
Arecipe uses 2 cups of sugar to make 32 brownies. how many cups of sugar are needed to make 72 brownies?
Answers: 1

Mathematics, 21.06.2019 18:30
You were told that the amount of time lapsed between consecutive trades on the new york stock exchange followed a normal distribution with a mean of 15 seconds. you were also told that the probability that the time lapsed between two consecutive trades to fall between 16 to 17 seconds was 13%. the probability that the time lapsed between two consecutive trades would fall below 13 seconds was 7%. what is the probability that the time lapsed between two consecutive trades will be between 14 and 15 seconds?
Answers: 3

Mathematics, 21.06.2019 19:00
Tabby sells clothing at a retail store, and she earns a commission of 6.25% on all items she sells. last week she sold a pair of jeans for $32.50, a skirt for $18.95, and 2 blouses for $14.95 each. what was tabby's total commission? a $4.15 b $5.08 c $81.35 d $348.60
Answers: 1

Mathematics, 21.06.2019 19:40
It appears that people who are mildly obese are less active than leaner people. one study looked at the average number of minutes per day that people spend standing or walking. among mildly obese people, the mean number of minutes of daily activity (standing or walking) is approximately normally distributed with mean 376 minutes and standard deviation 64 minutes. the mean number of minutes of daily activity for lean people is approximately normally distributed with mean 528 minutes and standard deviation 107 minutes. a researcher records the minutes of activity for an srs of 7 mildly obese people and an srs of 7 lean people. use z-scores rounded to two decimal places to answer the following: what is the probability (image for it appears that people who are mildly obese are less active than leaner people. one study looked at the averag0.0001) that the mean number of minutes of daily activity of the 6 mildly obese people exceeds 420 minutes? what is the probability (image for it appears that people who are mildly obese are less active than leaner people. one study looked at the averag0.0001) that the mean number of minutes of daily activity of the 6 lean people exceeds 420 minutes?
Answers: 1
You know the right answer?
3. a) Which of the following mapping diagrams represents the relation {(1,6),
(2,5), (2,7), (7,9),...
Questions


Mathematics, 26.06.2019 00:00


Mathematics, 26.06.2019 00:00


Mathematics, 26.06.2019 00:00

Mathematics, 26.06.2019 00:00


History, 26.06.2019 00:00


Mathematics, 26.06.2019 00:00


Chemistry, 26.06.2019 00:00

History, 26.06.2019 00:00

Biology, 26.06.2019 00:00


