
Mathematics, 28.04.2021 22:10 emmagossett2002
The scatter plot shows the number of pumpkins that have been picked on the farm during the month of October:
A scatter plot with points showing an upward trend with points that are moderately spread out from a line of best fit. The y axis is labeled Number of Pumpkins and the x axis is labeled Days in October
Part A: Using computer software, a correlation coefficient of r = 0.51 was calculated. Based on the scatter plot, is that an accurate value for this data? Why or why not? (5 points)
Part B: Instead of comparing the number of pumpkins picked and the day in October, write a scenario that would be a causal relationship for pumpkins picked on the farm. (5 points)

Answers: 2


Another question on Mathematics
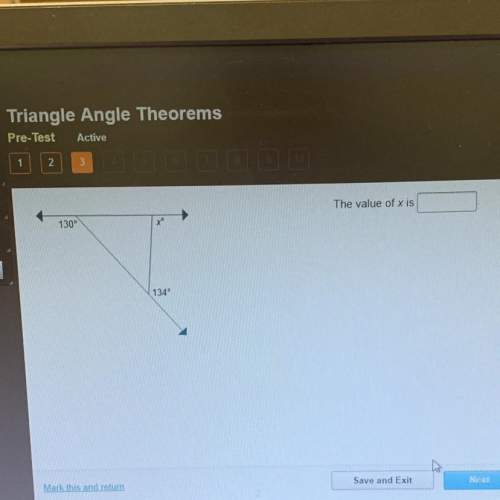
Mathematics, 21.06.2019 19:30
The length of a shadow of the building is 36m. the length of the pole, which is perpendicular to the ground, is 1.9m. the length of the pole's shadow is 1.52m. what is the height of the building?
Answers: 1
Mathematics, 21.06.2019 20:00
Find the value of x. give reasons to justify your solutions! l, m ∈ kn
Answers: 3
Mathematics, 21.06.2019 21:00
Which expression is equal to (21)(7)(3x) using the associative property? (21 · 7 · 3)x (7)(21)(3x) 32(7 + 3x) (3x)(7)(21)
Answers: 2
Mathematics, 21.06.2019 22:00
Harry and jay are both flying on the same plane with an airline that randomly assigns seats to passengers. of the 182 total seats on the plane, 62 are window seats, 58 are middle seats, and the rest are aisle seats. what is the approximate probability that both harry and jay will be assigned aisle seats on the same plane? a. 11.48% b. 3.3% c. 2.08% d. 26.26%
Answers: 3
You know the right answer?
The scatter plot shows the number of pumpkins that have been picked on the farm during the month of...
Questions

History, 31.01.2020 02:47


Social Studies, 31.01.2020 02:47


English, 31.01.2020 02:47
Health, 31.01.2020 02:47
Social Studies, 31.01.2020 02:47
History, 31.01.2020 02:47
Mathematics, 31.01.2020 02:47
Mathematics, 31.01.2020 02:47
Mathematics, 31.01.2020 02:47
History, 31.01.2020 02:47


