
Mathematics, 28.04.2021 22:30 nathangirnet
Scatter Plots
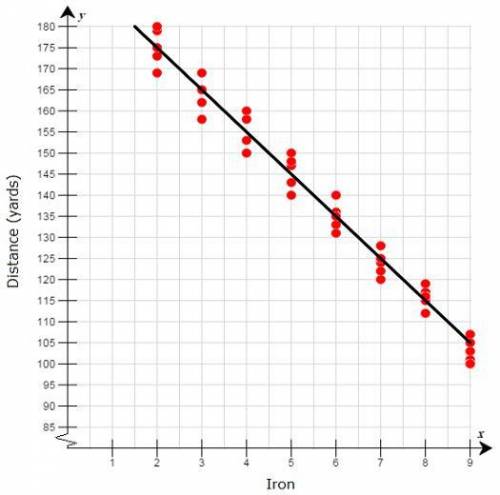
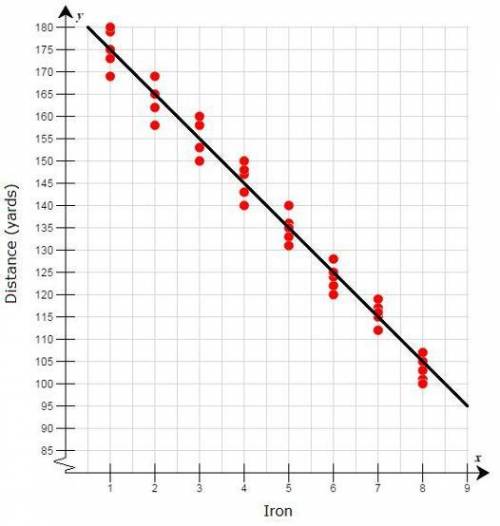
Laura went to a golf shop that has a golf simulator. The simulator estimates the distance that each ball she hits would have gone. She hit five balls each with her 2, 3, 4, 5, 6, 7, 8, and 9 irons. The distances of her golf shots are given in the table. Keep this table window open as you work on the tasks in this activity.
When Laura graphed the data, she got this scatter plot and drew a line of best fit. Keep the scatter plot window open as you work on the tasks in this activity.
When her brother graphed the data, he got a different scatter plot and drew a line of best fit. Keep the scatter plot window open as you work on the tasks in this activity.
Part A
Whose scatter plot matches the data, and what is wrong with the incorrect scatter plot?
Part B
Using the correct graph, describe the association shown.
Part C
What is the slope of the line in the correct graph? What is the slope of the line in the incorrect graph? Are the slopes the same or different?
Part D
What is the y-intercept of the correct graph? What is the y-intercept of the incorrect graph? Are the y-intercepts the same?
Part E
If Laura were able to find a 0 iron, about how far could she hit it?
Part F
About what is the average change in distance for each increase of 1 in the iron number? What does this mean in terms of the situation?
The Table
Iron Distance Iron Distance Iron Distance
2 179 5 150 8 119
2 169 5 147 8 115
2 173 5 148 8 112
2 175 5 140 8 117
2 180 5 143 8 116
3 158 6 136 9 105
3 169 6 140 9 108
3 165 6 135 9 100
3 162 6 131 9 101
3 165 6 133 9 103
4 153 7 128
4 158 7 124
4 153 7 120
4 160 7 122
4 150 7 125

Answers: 2


Another question on Mathematics
Mathematics, 21.06.2019 16:10
To find the extreme values of a function f(x.y) on a curve x-x(t), y y(t), treat f as a function of the single variable t and use the chain rule to find where df/dt is zero. in any other single-variable case, the extreme values of f are then found among the values at the critical points (points where df/dt is zero or fails to exist), and endpoints of the parameter domain. find the absolute maximum and minimum values of the following function on the given curves. use the parametric equations x=2cos t, y 2 sin t functions: curves: i) the semicircle x4,y20 i) the quarter circle x2+y-4, x20, y20 b, g(x,y)=xy
Answers: 2
Mathematics, 21.06.2019 21:00
Mr. thompson is on a diet. he currently weighs 260 pounds. he loses 4 pounds per month. what part of the story makes the relationship not proportional?
Answers: 3
Mathematics, 21.06.2019 21:30
Suppose that sahil knows that 45 people with ages of 18 to 29 voted. without using a calculator, he quickly says then 135 people with ages of 30to 49 voted. is he correct? how might sohil have come up with his answer so quickly?
Answers: 3
You know the right answer?
Scatter Plots
Laura went to a golf shop that has a golf simulator. The simulator estimates the dis...
Questions

English, 12.01.2020 09:31


Biology, 12.01.2020 09:31

History, 12.01.2020 09:31

Physics, 12.01.2020 09:31
Mathematics, 12.01.2020 09:31

Mathematics, 12.01.2020 09:31
Mathematics, 12.01.2020 09:31
English, 12.01.2020 09:31
Mathematics, 12.01.2020 09:31


