
Mathematics, 29.04.2021 01:50 galaalexa
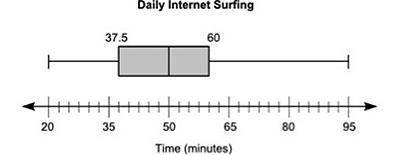
The box plot below shows the total amount of time, in minutes, the students of a class surf the Internet every day:
A box plot is shown. The left-most point on the plot is 20 and the right-most point is 95. The box is labeled 37.5 on the left edge and 60 on the right edge. A vertical line is drawn inside the rectangle at the point 50.
Part A: List two pieces of information that are provided by the graph and one piece of information that is not provided by the graph. (4 points)
Part B: Calculate the interquartile range of the data, and explain in a sentence or two what it represents. (4 points)
Part C: Explain what effect, if any, there will be if an outlier is present. (2 points)

Answers: 3


Another question on Mathematics
Mathematics, 21.06.2019 19:00
What is the expression in factored form? 3x^2 + 18x + 24 a. 3(x+2)(x+4) b. 3(x-2)(x+4) c. 3(x-2)(x-4) d. 3(x+2)(x-4)
Answers: 2
Mathematics, 21.06.2019 20:30
Which shows the graph of the solution set of 3y – 2x > –18?
Answers: 1
Mathematics, 21.06.2019 22:00
You are standing next to a really big circular lake. you want to measure the diameter of the lake, but you don't want to have to swim across with a measuring tape! you decide to walk around the perimeter of the lake and measure its circumference, and find that it's 400\pi\text{ m}400? m. what is the diameter dd of the lake?
Answers: 3
You know the right answer?
The box plot below shows the total amount of time, in minutes, the students of a class surf the Inte...
Questions
Mathematics, 13.11.2020 14:00
Mathematics, 13.11.2020 14:00

Social Studies, 13.11.2020 14:00

English, 13.11.2020 14:00


Biology, 13.11.2020 14:00

History, 13.11.2020 14:00
English, 13.11.2020 14:00
History, 13.11.2020 14:00

Advanced Placement (AP), 13.11.2020 14:00
Mathematics, 13.11.2020 14:00

Chemistry, 13.11.2020 14:00


