
Mathematics, 29.04.2021 08:00 joyandfaye
WILL GIVE BRAINLIEST
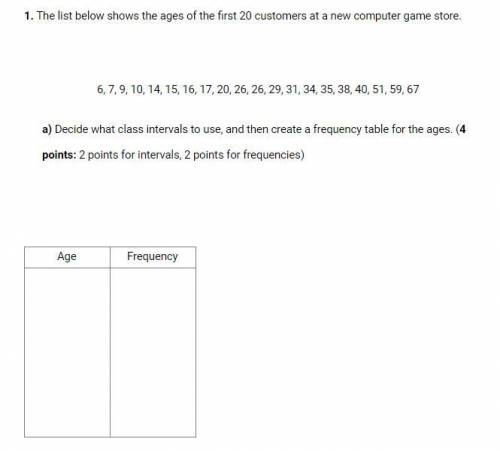
1. The list below shows the ages of the first 20 customers at a new computer game store.
6, 7, 9, 10, 14, 15, 16, 17, 20, 26, 26, 29, 31, 34, 35, 38, 40, 51, 59, 67
a) Decide what class intervals to use, and then create a frequency table for the ages. (4 points: 2 points for intervals, 2 points for frequencies)
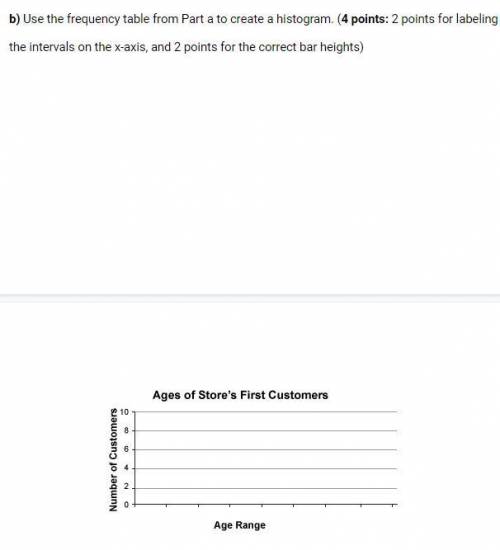
b) Use the frequency table from Part a to create a histogram. (4 points: 2 points for labeling the intervals on the x-axis, and 2 points for the correct bar heights)
2. The list below shows the number of computer games a store sold each day for the first 11 days it was open.
27, 28, 29, 35, 35, 36, 37, 42, 43, 46, 79
a) Find the five-number summary for the data. Show your work. (5 points: 1 point for each number)
b) Use your results from Part a to display the data on a box plot. (2 points)
c) Use your box plot from Part b to find the interquartile range (IQR) of the data. (1 point)
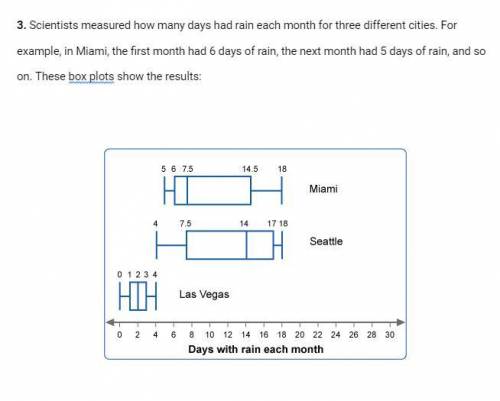
3. Scientists measured how many days had rain each month for three different cities. For example, in Miami, the first month had 6 days of rain, the next month had 5 days of rain, and so on. These box plots show the results:
a) Fill in the blanks to describe the shape of each box plot. (3 points: 1 point for each blank)
Miami: _
Seattle: _
Las Vegas: _
b) Fill in the blanks to compare the centers of the three box plots. (4 points: 1 point for each blank)
Better measure of center to use: _
Center for Miami: 7.5 days
Center for Seattle: _ days
Center for Las Vegas: _ days
Which city had the largest typical number of days of rain each month? _
c) Find and compare the spreads of the three box plots. (3 points: 1 point for each blank)
Better measure of spread to use: _
Spread for Miami: 8.5 days
Spread for Seattle: _ days
Spread for Las Vegas: 2 days
Which city had the lowest variation in the days of rain each month? _
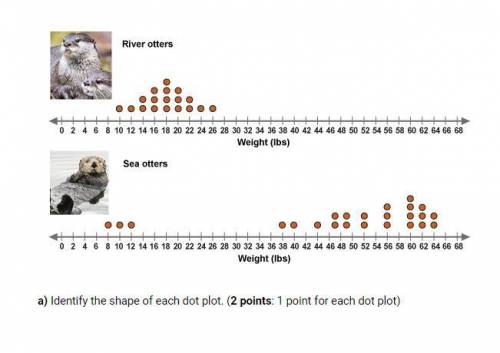
4. Researchers weighed a sample of river otters and a sample of sea otters. These dot plots show the results (rounded to the nearest pound).
a) Identify the shape of each dot plot. (2 points: 1 point for each dot plot)
b) Which dot plot has a larger center? What does this mean in terms of the otters? (2 points: 1 point for each question)
c) Identify any outliers. What do you think the outliers represent? (2 points: 1 point for identifying, 1 for explanation)
d) Which dot plot has a larger spread?(1 point)
e) How do the outliers affect the spread of the dot plot? (1 point)
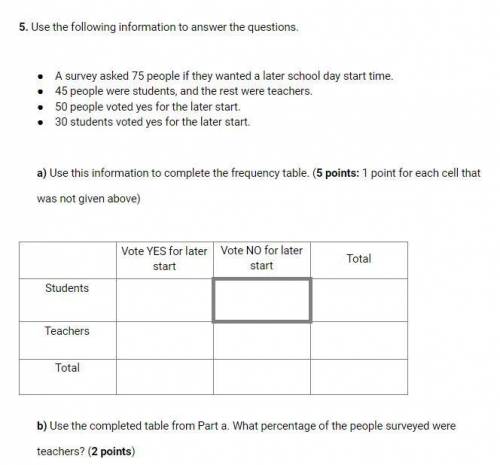
5. Use the following information to answer the questions.
A survey asked 75 people if they wanted a later school day start time.
45 people were students, and the rest were teachers.
50 people voted yes for the later start.
30 students voted yes for the later start.
a) Use this information to complete the frequency table. (5 points: 1 point for each cell that was not given above)
b) Use the completed table from Part a. What percentage of the people surveyed were teachers? (2 points)
c) Use the completed table from Part a. What percentage of the people surveyed were teachers who wanted a later start time? (2 points)
d) What does the number in the bolded cell represent? (1 point)
6. Middle school class representatives conducted a poll during lunch to see which activity students wanted for their year-end party. The results are shown in this relative frequency table:
a) For the entire school, which was more popular, water slides or roller skating? (1 point)
b) 34% of the 6th graders and 50% of the 7th graders want to go to the water slides. What percentage of the 8th graders want to go to the water slides? (1 point)
c) Does there seem to an association between grade level and field trip choice? (2 points)
d) If this trend continued, would you expect 9th graders to prefer the water slides or roller skating? Explain your answer. (2 points)

Answers: 3


Another question on Mathematics
Mathematics, 21.06.2019 17:30
Describe the 2 algebraic methods you can use to find the zeros of the function f(t)=-16t^2+400.
Answers: 3
Mathematics, 21.06.2019 20:30
Steve had 48 chocolates but he decided to give 8 chocolats to each of his f coworkers. how many chocolates does steve have left
Answers: 1
Mathematics, 21.06.2019 21:40
Question 1 of 10 2 points different groups of 50 graduates of an engineering school were asked the starting annual salary for their first engineering job after graduation, and the sampling variability was low. if the average salary of one of the groups was $65,000, which of these is least likely to be the average salary of another of the groups? o a. $64,000 o b. $65,000 o c. $67,000 o d. $54,000
Answers: 2
You know the right answer?
WILL GIVE BRAINLIEST
1. The list below shows the ages of the first 20 customers at a new computer...
Questions
Mathematics, 25.08.2019 12:00

Mathematics, 25.08.2019 12:00


Physics, 25.08.2019 12:00
Social Studies, 25.08.2019 12:00
Mathematics, 25.08.2019 12:00
Mathematics, 25.08.2019 12:00

History, 25.08.2019 12:00

History, 25.08.2019 12:00
Mathematics, 25.08.2019 12:00
History, 25.08.2019 12:00
Geography, 25.08.2019 12:00
English, 25.08.2019 12:00


