
Mathematics, 29.04.2021 09:40 hapjajsjjz3738
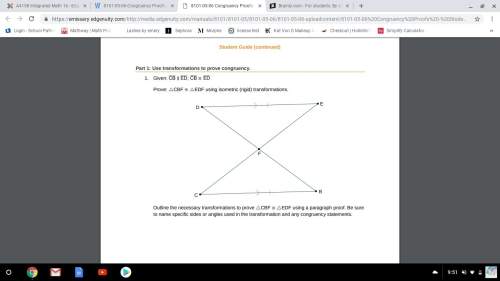
The scatter plot shows the relationship between the number of homework assignments turned in over a week and the test score for that same week:
A scatter plot is shown. The x-axis is labeled Homework Assignments Submitted and the y-axis is labeled test score. Data points are located at 1 and 30, 2 and 70, 2 and 75, 3 and 80, 5 and 100, 4 and 100, 4 and 90, 5 and 95, and 1 and 60. A circle labeled X surrounds all of the points except 1 and 30. The point 1 and 30 is labeled Y.
Part A: What is the group of points labeled X called? What is the point labeled Y called? Give a possible reason for the presence of point Y. (3 points)
Part B: Describe the association between a student's test scores and the number of homework assignments submitted. (2 points)

Answers: 3


Another question on Mathematics
Mathematics, 21.06.2019 18:00
What is the rate of change of a line that passes through (2,-5) and (6,-2)?
Answers: 2
Mathematics, 21.06.2019 18:00
Write the fraction or mixed number and the decimal shown by the model
Answers: 2
Mathematics, 21.06.2019 21:30
Two airplanes start at the same place and travel in opposite directions,one at 395 miles per hour and the other at 422 miles per hour. how many hours will it take for the planes to be 2451 miles apart?
Answers: 1
Mathematics, 22.06.2019 01:30
Which ordered pair is the best estimate for the solution of the system of equations? the graph of the system of equations : y = 3/2x +6 and y=1/4x - 2 , -3) .5, -3.5) , -4) , -3.5)
Answers: 3
You know the right answer?
The scatter plot shows the relationship between the number of homework assignments turned in over a...
Questions

Mathematics, 25.03.2020 06:46

Mathematics, 25.03.2020 06:46
Mathematics, 25.03.2020 06:46

Biology, 25.03.2020 06:46
Mathematics, 25.03.2020 06:46
English, 25.03.2020 06:46
Mathematics, 25.03.2020 06:46
Mathematics, 25.03.2020 06:46

History, 25.03.2020 06:46
English, 25.03.2020 06:46
Mathematics, 25.03.2020 06:46

Computers and Technology, 25.03.2020 06:46


