
Mathematics, 29.04.2021 21:50 jlbradley429
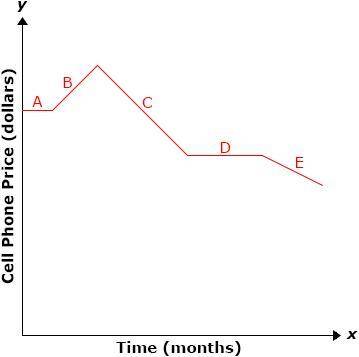
The price of a cell phone model was tracked over a ten-month period. The graph shows the relationship between the price of the phone and the time.
How does part E of the graph relate to the situation?
A.
Part E represents a period when the price was not tracked.
B.
Part E represents a period when the price remained the same.
C.
Part E represents a period when the price decreased at the fastest rate.
D.
Part E represents a period when the price decreased at a slower rate than in part C.

Answers: 3


Another question on Mathematics
Mathematics, 21.06.2019 16:00
Aline has a slope of 1/4 and passes through point (0.4,-1/2). what is the value of the y-intercept?
Answers: 2
Mathematics, 21.06.2019 19:40
The weights of broilers (commercially raised chickens) are approximately normally distributed with mean 1387 grams and standard deviation 161 grams. what is the probability that a randomly selected broiler weighs more than 1,425 grams?
Answers: 2
Mathematics, 21.06.2019 20:30
The cost for an uberi is $2.50 plus $2.00 mile. if the total for the uber ride was $32.50, how many miles did the customer travel?
Answers: 3
Mathematics, 21.06.2019 21:40
Drag the tiles to the correct boxes to complete the pairs. using the properties of integer exponents, match each expression with the correct equivalent expression.
Answers: 1
You know the right answer?
The price of a cell phone model was tracked over a ten-month period. The graph shows the relationshi...
Questions
Mathematics, 12.02.2020 23:53

Biology, 12.02.2020 23:53


Mathematics, 12.02.2020 23:53

Mathematics, 12.02.2020 23:53

History, 12.02.2020 23:53


