
Mathematics, 29.04.2021 22:40 kennyg02
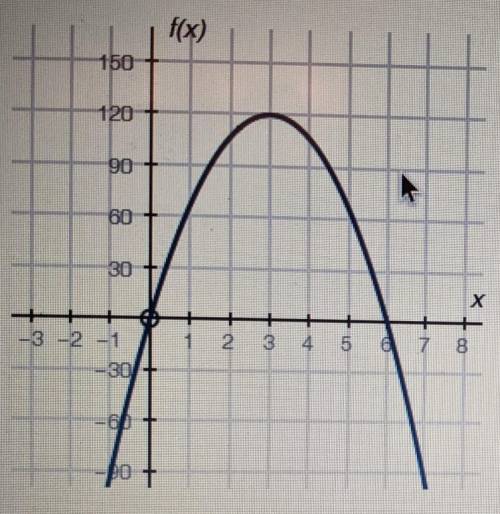
The graph below (linked) shows a company's profit f(x), in dollars, depending on the price of pens x, and dollars, being sold by the company:
Part A: What do the X intercepts and maximum value of the graph represent? What are the intervals where the function is increasing and decreasing, and what do they represent about the sale and profit? (6points)
Part B: What is an approximate average rate of change of the graph from x = 3 to x = 5, and what does this rate represent? (4 points)
(PLEASEEE explain. I am trying to understand this as best as possible)

Answers: 1


Another question on Mathematics
Mathematics, 21.06.2019 14:30
Which of the following lines is parallel to x=4? a- 3y=9 b- y=4 c- x=2 d- x=y answer this as soon as possible xoxo lo ; )
Answers: 3
Mathematics, 21.06.2019 18:00
Marla bought a book for $12.95, a binder for $3.49, and a backpack for $44.99. the sales tax rate is 6%. find the amount of tax and the total she paid for these items
Answers: 3
Mathematics, 21.06.2019 18:30
The measure of one angle of an octagon is two times smaller that of the other seven angles. what is the measure of each angle?
Answers: 3
Mathematics, 22.06.2019 00:00
Cole says the distance between points (-5,0) and (0,-5)is 5 units. is he correct? explain why or why not.
Answers: 1
You know the right answer?
The graph below (linked) shows a company's profit f(x), in dollars, depending on the price of pens x...
Questions
Mathematics, 11.02.2021 22:10

Biology, 11.02.2021 22:10

English, 11.02.2021 22:10


History, 11.02.2021 22:10
English, 11.02.2021 22:10

Social Studies, 11.02.2021 22:10
Mathematics, 11.02.2021 22:10
Mathematics, 11.02.2021 22:10


Computers and Technology, 11.02.2021 22:10


