
Mathematics, 30.04.2021 17:30 dodsonh16
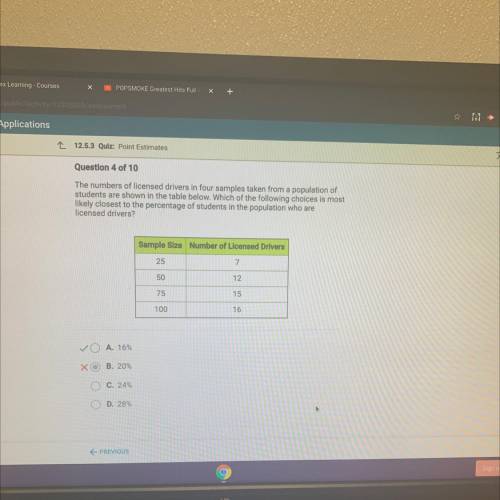
The numbers of licensed drivers in four samples taken from a population of
students are shown in the table below. Which of the following choices is most
likely closest to the percentage of students in the population who are
licensed drivers?
Sample Size Number of Licensed Drivers
25
7
50
12
75
15
100
16
O A. 16%
O B. 20%
ОООО
C. 24%
O D. 28%

Answers: 3


Another question on Mathematics
Mathematics, 21.06.2019 16:50
The verbal translation for the difference of m and 7 increased by 15
Answers: 3
Mathematics, 21.06.2019 19:00
Asap its important using the information in the customer order, determine the length and width of the garden. enter the dimensions.length: feetwidth: feet
Answers: 3
Mathematics, 21.06.2019 20:00
Afamily has five members. a mom, a dad, two sisters, & a brother. the family lines up single file. what is the probabillity that the mom is at the front of the line
Answers: 1
Mathematics, 21.06.2019 22:30
Ineed big ! the cost of a school banquet is $25 plus $15 for each person attending. create a table, sketch the graph, and write an equation in slope-intercept and point-slope form that gives total cost as a function of the number of people attending. what is the cost for 77 people?
Answers: 1
You know the right answer?
The numbers of licensed drivers in four samples taken from a population of
students are shown in t...
Questions


Mathematics, 20.07.2021 20:00
English, 20.07.2021 20:00
Mathematics, 20.07.2021 20:00

History, 20.07.2021 20:00
Biology, 20.07.2021 20:00
English, 20.07.2021 20:00
History, 20.07.2021 20:00


Geography, 20.07.2021 20:00
Mathematics, 20.07.2021 20:00

Arts, 20.07.2021 20:10


