
Mathematics, 30.04.2021 21:10 Inrt8134
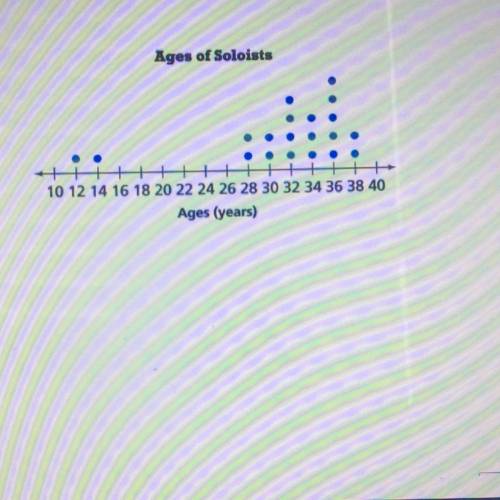
The dot plot shows the ages of soloists in a orchestra. Answer the following questions below.
A. Is the mean, median or model the best measure of center for this data?
B. Find the measure of center you chose for part A.
C. Does the data have an outlier? (Answer Yes or No)
D. Is the data skewed? If so, is it skewed right or skewed left? (Answer Left or Right or Not Skewed)

Answers: 1


Another question on Mathematics
Mathematics, 21.06.2019 17:20
What other information do you need to prove triangle dac=bca by asa
Answers: 1
Mathematics, 21.06.2019 21:00
In the figure below, triangle rpq is similar to triangle rts. what is the distance between p and q? a. 24 b. 42 c.50 d. 54
Answers: 1
Mathematics, 21.06.2019 22:20
Let f(x) = 5/x and g(x)=2x2+5x. what two numbers are not in the domain of f o g
Answers: 2
Mathematics, 21.06.2019 23:30
Peyton's field hockey team wins 4 games out of every 7 games played. her team lost 9 games. how many games did peyton's team play?
Answers: 2
You know the right answer?
The dot plot shows the ages of soloists in a orchestra. Answer the following questions below.
A. I...
Questions
Mathematics, 27.01.2021 19:50
Mathematics, 27.01.2021 19:50


Mathematics, 27.01.2021 19:50
Mathematics, 27.01.2021 19:50

History, 27.01.2021 19:50
Mathematics, 27.01.2021 19:50

Computers and Technology, 27.01.2021 19:50

Business, 27.01.2021 19:50
Computers and Technology, 27.01.2021 19:50
Mathematics, 27.01.2021 19:50


