
Mathematics, 30.04.2021 21:40 Nathanr23
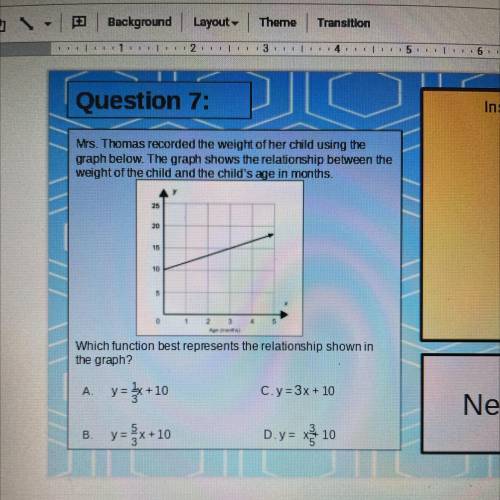
Mrs. Thomas recorded the weight of her child using the
graph below. The graph shows the relationship between the
weight of the child and the child's age in months.
25
20
15
10
5
1
2
3
Which function best represents the relationship shown in
the graph?
A. y= {x+10
C. y=3x + 10
B
y=-x+10
D. y= xỷ 10

Answers: 1


Another question on Mathematics
Mathematics, 21.06.2019 17:20
Which of these equations, when solved, gives a different value of x than the other three? a9.1 = -0.2x + 10 b10 = 9.1 + 0.2x c10 – 0.2x = 9.1 d9.1 – 10 = 0.2x
Answers: 1
Mathematics, 21.06.2019 18:00
The price of an item has been reduced by 30%. the original price was $30. what is the price of the item now ?
Answers: 1
Mathematics, 21.06.2019 18:30
Two angles are complementary. the large angle is 36 more than the smaller angle. what is the measure of the large angle?
Answers: 1
You know the right answer?
Mrs. Thomas recorded the weight of her child using the
graph below. The graph shows the relations...
Questions
Mathematics, 12.07.2019 21:30


History, 12.07.2019 21:30


History, 12.07.2019 21:30
Mathematics, 12.07.2019 21:30

Spanish, 12.07.2019 21:30


