
Mathematics, 30.04.2021 22:20 organicmemez
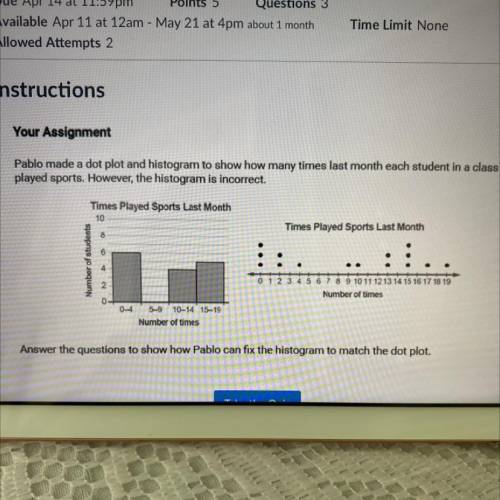
Pablo made a dot plot and histogram to show how many times last month each student in a class
played sports. However, the histogram is incorrect.
Times Played Sports Last Month
10
Times Played Sports Last Month
Number of students
0 1 2 3 4 5 6 7 8 9 10 11 12 13 14 15 16 17 18 19
Number of times
5-9
10-14 15-19
Number of times
Answer the questions to show how Pablo can fix the histogram to match the dot plot.

Answers: 1


Another question on Mathematics
Mathematics, 22.06.2019 00:00
At noon a tank contained 10cm water. after several hours it contained 7cm of water. what is the percent decrease of water in the tank?
Answers: 1
Mathematics, 22.06.2019 00:00
The statements below can be used to prove that the triangles are similar. ? △abc ~ △xyz by the sss similarity theorem. which mathematical statement is missing? ∠b ≅ ∠y ∠b ≅ ∠z
Answers: 3
Mathematics, 22.06.2019 02:30
Graph the function =gx+2x3 and give its domain and range using interval notation.
Answers: 3
Mathematics, 22.06.2019 03:30
The slope of the line passing through the points (2, 7) and (-4, 8) is
Answers: 2
You know the right answer?
Pablo made a dot plot and histogram to show how many times last month each student in a class
play...
Questions


Social Studies, 01.12.2021 03:00


Physics, 01.12.2021 03:00

Mathematics, 01.12.2021 03:00

History, 01.12.2021 03:00
English, 01.12.2021 03:00
English, 01.12.2021 03:00

Health, 01.12.2021 03:00


