
Mathematics, 03.05.2021 05:40 ashleyacosta
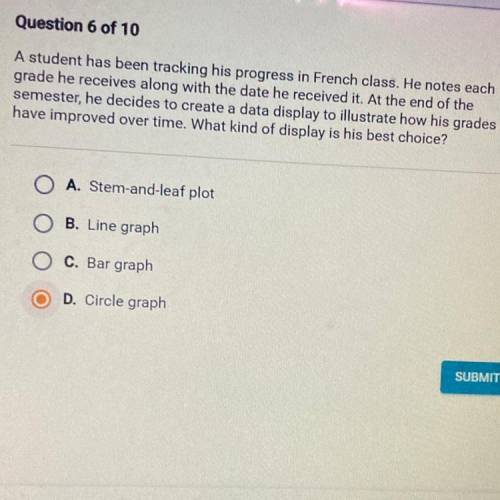
A student has been tracking his progress in French class. He notes each
grade he receives along with the date he received it. At the end of the
semester, he decides to create a data display to illustrate how his grades
have improved over time. What kind of display is his best choice?
O A. Stem-and-leaf plot
O B. Line graph
O C. Bar graph
D. Circle graph

Answers: 2


Another question on Mathematics
Mathematics, 21.06.2019 17:30
At a sale this week, a desk is being sold for $213. this is a 29% discount from the original price. what is the original price?
Answers: 1
Mathematics, 21.06.2019 20:00
Anature center offer 2 guided walks. the morning walk is 2/3 miles. the evening walk is 3/6 mile. which is shorter
Answers: 1
Mathematics, 21.06.2019 23:00
Sam is picking fruit from a basket that contains many different kinds of fruit. which set of events is independent?
Answers: 1
You know the right answer?
A student has been tracking his progress in French class. He notes each
grade he receives along w...
Questions


History, 01.07.2020 16:01
Mathematics, 01.07.2020 16:01


Mathematics, 01.07.2020 16:01

Computers and Technology, 01.07.2020 16:01

English, 01.07.2020 16:01


