
Mathematics, 03.05.2021 21:00 jamaicalove2880
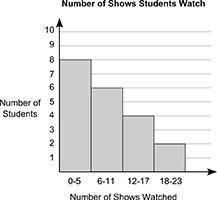
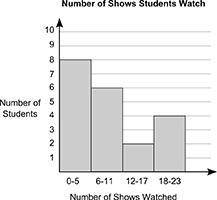
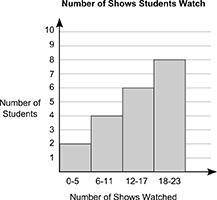
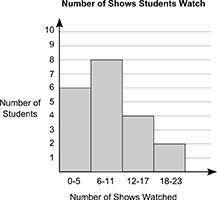
The following data shows the number of music shows 20 students of a class watched in a month:
4 13 13 19 7 4 3 4 4 19 7 9 4 19 4 4 10 10 8 20
Which histogram represents this data? (1 point)

Answers: 2


Another question on Mathematics
Mathematics, 22.06.2019 01:00
The balance of susu's savings account can be represented by the variable b. the inequality describing her balance b > $30 . which could be a solution to the inequality?
Answers: 2
Mathematics, 22.06.2019 02:10
The price of one share of a company’s stock declined $13.89 every day for 2.5 days what was the stocks total decline in price
Answers: 1
Mathematics, 22.06.2019 03:00
The seventh-grade students at charleston middle school are choosing one girl and one boy for student council. their choices for girls are michaela (m), candice (c), and raven (r), and for boys, neil (n), barney (b), and ted (t). the sample space for the combined selection is represented in the table. complete the table and the sentence beneath it.
Answers: 1
Mathematics, 22.06.2019 03:10
Each side length of the hexagons is 1, what’s the area of abc
Answers: 1
You know the right answer?
The following data shows the number of music shows 20 students of a class watched in a month:
4 13...
Questions
Mathematics, 29.04.2021 21:10

Mathematics, 29.04.2021 21:10
Mathematics, 29.04.2021 21:10

Mathematics, 29.04.2021 21:10
Mathematics, 29.04.2021 21:10

Biology, 29.04.2021 21:10
Mathematics, 29.04.2021 21:10
Mathematics, 29.04.2021 21:10
Mathematics, 29.04.2021 21:10
Mathematics, 29.04.2021 21:10

Chemistry, 29.04.2021 21:10


