
Mathematics, 04.05.2021 01:40 deadpoolcorvettehats
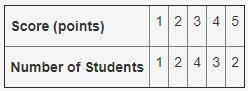
A group of 12 students participated in a dance competition. Their scores are in the image attached
Would a dot plot or a histogram best represent the data presented here? Why?
Histogram, because a large number of scores are reported as ranges
Histogram, because a small number of scores are reported individually
Dot plot, because a large number of scores are reported as ranges
Dot plot, because a small number of scores are reported individually

Answers: 3


Another question on Mathematics
Mathematics, 21.06.2019 16:00
Find the average speed of a rabbit that runs a distance of 22 m in a time of 1.8 s .
Answers: 1
Mathematics, 21.06.2019 18:00
On saturday a souvenir shop had 125 customers.sixty four percent of the costumers paid with a credit card. how many costumers paid with cash?
Answers: 1
Mathematics, 21.06.2019 19:00
Which of the expressions (on the photo document i inserted) together represent all solutions to the following equation? 8cos(12x)+4=-4 *the answer should be in degrees.* > i would like for someone to explain the process to find the solutions for this.
Answers: 2
Mathematics, 22.06.2019 01:00
£100.80 divided by 14 equals 7.2 how would we put this as money
Answers: 1
You know the right answer?
A group of 12 students participated in a dance competition. Their scores are in the image attached...
Questions
Mathematics, 18.07.2019 13:30

Advanced Placement (AP), 18.07.2019 13:30


Biology, 18.07.2019 13:30

Health, 18.07.2019 13:30

Biology, 18.07.2019 13:30

History, 18.07.2019 13:30
History, 18.07.2019 13:30
History, 18.07.2019 13:30
Social Studies, 18.07.2019 13:30


