
Mathematics, 04.05.2021 21:40 lolz55678
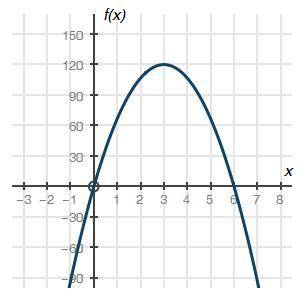
The graph below shows a company's profit f(x), in dollars, depending on the price of pens x, in dollars, sold by the company:
Graph of quadratic function f of x having x intercepts at ordered pairs 0, 0 and 6, 0. The vertex is at 3, 120. [graph below]
Part A: What do the x-intercepts and maximum value of the graph represent? What are the intervals where the function is increasing and decreasing, and what do they represent about the sale and profit? (4 points)
Part B: What is an approximate average rate of change of the graph from x = 3 to x = 5, and what does this rate represent? (3 points)
Part C: Describe the constraints of the domain. (3 points)

Answers: 3


Another question on Mathematics
Mathematics, 21.06.2019 19:10
Which ordered pair is a solution of the equation? y + 5 = 2(2+1) choose 1 answer ® only (5,10 ® only (-1,-5) © both (5, 10) and (-1,-5) 0 neither
Answers: 1
Mathematics, 21.06.2019 20:20
Convert the mixed numbers into improper fractions. convert the improper fraction to mixed numbers.
Answers: 1
Mathematics, 21.06.2019 21:40
Ineed your ! i was to turn this into pond first thing i gotta do is outline the inside with this plastic how big should i cut the plastic the height: 10 1/2” the length: 40” the width: 12” me !
Answers: 1
You know the right answer?
The graph below shows a company's profit f(x), in dollars, depending on the price of pens x, in doll...
Questions


Biology, 29.08.2021 14:00

English, 29.08.2021 14:00


Computers and Technology, 29.08.2021 14:00
Mathematics, 29.08.2021 14:00
Mathematics, 29.08.2021 14:00

Mathematics, 29.08.2021 14:00
Mathematics, 29.08.2021 14:00
English, 29.08.2021 14:00
History, 29.08.2021 14:00
Biology, 29.08.2021 14:00
Computers and Technology, 29.08.2021 14:00


