The graph below shows the solution set of which inequality?
A. x < 4
B. x2 > 16
...

Mathematics, 04.05.2021 23:00 cocodemain
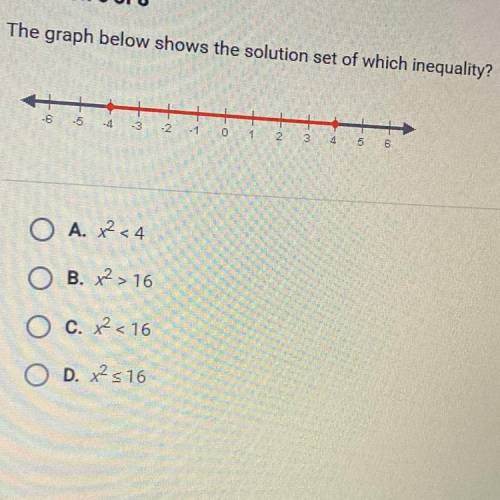
The graph below shows the solution set of which inequality?
A. x < 4
B. x2 > 16
C. x2 < 16
D. x2 = 16

Answers: 2


Another question on Mathematics
Mathematics, 21.06.2019 19:00
Candy lives in the center of town. her friend darlene lives 28 miles to the east and her friend dana lives 21 miles north. approximately how far do dana and darline live apart ?
Answers: 1
Mathematics, 21.06.2019 23:00
Afamily went out to dinner and their bill was $113.if they want to leave a 19% tip, how much should they leave.
Answers: 2
Mathematics, 21.06.2019 23:50
The graph of a curve that passes the vertical line test is a:
Answers: 3
You know the right answer?
Questions
Mathematics, 18.03.2021 21:20

Biology, 18.03.2021 21:20
Mathematics, 18.03.2021 21:20
Mathematics, 18.03.2021 21:20

Mathematics, 18.03.2021 21:20

Mathematics, 18.03.2021 21:20
Biology, 18.03.2021 21:20
English, 18.03.2021 21:20
Mathematics, 18.03.2021 21:20
History, 18.03.2021 21:20
Mathematics, 18.03.2021 21:20


