
Mathematics, 05.05.2021 01:00 shontelsims
4.
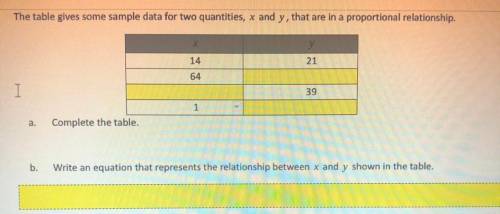
The table gives some sample data for two quantities, x and y, that are in a proportional relationship.
X
у
21
14
64
39
a.
Complete the table.
I
b.
Write an equation that represents the relationship between x and y shown in the table.
Graph the relationship. Use a scale for the axes that shows all the points in the table.

Answers: 2


Another question on Mathematics
Mathematics, 21.06.2019 19:00
You got a job selling magazines door-to-door. you are paid $100 per day plus $1.50 for each magazine you sell. which recursive formula models this situation?
Answers: 1
Mathematics, 21.06.2019 20:30
Which shows the graph of the solution set of 3y – 2x > –18?
Answers: 1
Mathematics, 21.06.2019 22:00
Which of the following is an example of conditional probability
Answers: 3
Mathematics, 21.06.2019 22:00
Carla was trying to decide what to do saturday evening. she has $100 available to spend for the evening. she has narrowed her choices down to these events: braves game, a concert of an artist she likes, or the georgia aquarium. admission to the braves game is $25, hot dogs cost $10, sodas cost $5. the concert costs $25 for admission, $20 for a souvernir t-shirt, and $10 for a soda. the georgia aquarium has the show of a lifetime with an all you can eat and drink that costs $100. carla does not want to take any driving chances, so in addition to the cost of the aquarium, she will also need to pay for her uber/lyft, which is $15 each way. which option should carla choose if she wants to spend the least? based on that choice, what then is carla's oppotunity cost? fully explain your answer in at least one paragraph.
Answers: 1
You know the right answer?
4.
The table gives some sample data for two quantities, x and y, that are in a proportional relati...
Questions
Mathematics, 10.06.2020 04:57


Biology, 10.06.2020 04:57


Medicine, 10.06.2020 04:57


