
Mathematics, 05.05.2021 19:50 biancabahena04
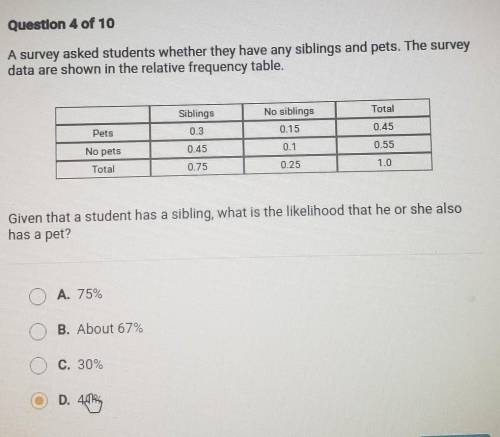
Question 4 of 10 A survey asked students whether they have any siblings and pets. The survey data are shown in the relative frequency table. Siblings No siblings Total Pets 0.3 0.15 0.45 No pets 0.45 0.1 0.55 Total 0.75 0.25 1.0 Given that a student has a sibling, what is the likelihood that he or she also has a pet? A. 75% B. About 67% C 30%. D. 40%

Answers: 1


Another question on Mathematics
Mathematics, 21.06.2019 17:00
Segment xy is dilated through point m with a scale factor of 2. which segment shows the correct result of the dilation
Answers: 1
Mathematics, 21.06.2019 20:00
If benito is selecting samples of five values from the table, which row will result in the greatest mean? population data row 1 4 2 2 3 3 row 2 3 3 4 3 2 row 3 2 4 3 4 3 row 4 3 4 4 7 3 row 1 row 2 r
Answers: 1
Mathematics, 21.06.2019 20:30
In the diagram of circle o, what is the measure of zabc?
Answers: 2
You know the right answer?
Question 4 of 10 A survey asked students whether they have any siblings and pets. The survey data ar...
Questions

History, 20.04.2021 22:40
History, 20.04.2021 22:40

Mathematics, 20.04.2021 22:40

History, 20.04.2021 22:40

Mathematics, 20.04.2021 22:40
Mathematics, 20.04.2021 22:40

French, 20.04.2021 22:40
English, 20.04.2021 22:40

Biology, 20.04.2021 22:40
Mathematics, 20.04.2021 22:40
Mathematics, 20.04.2021 22:40


