
Mathematics, 05.05.2021 23:10 lesleyy7278
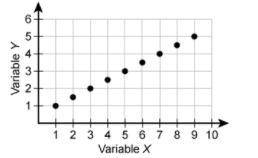
1.The graph shows an association between variables x and y. What is the type of association between variables x and y? (use first graph)
options:
no association
strong positive
perfect positive
strong negative
2.Which pair of data sets would most likely have no correlation?
options:
The number of pages in a textbook and the class size
The number of pages in a textbook and the amount of time it takes to read the textbook
The number of pages read in a textbook and the number of pages left to read in the textbook
The number of pages in a textbook and the weight of the textbook
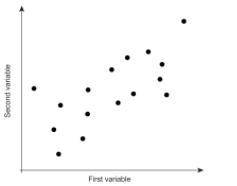
3.What type of association is shown between the first and second variables?
(use second graph)
options:
no association
moderate positive
weak negative
perfect negative

Answers: 1


Another question on Mathematics
Mathematics, 21.06.2019 17:30
Find the pattern and use it to list the nth term in the sequence. 6, 12, 20, 30, 42, 56, the nth term of the sequence is
Answers: 3
Mathematics, 21.06.2019 18:40
Complete the steps, which describe how to find the area of the shaded portion of the circle. find the area of the sector by multiplying the area of the circle by the ratio of the to 360. subtract the area of the triangle from the area of the sector.
Answers: 3
Mathematics, 21.06.2019 18:50
The number of fish in a lake can be modeled by the exponential regression equation y=14.08 x 2.08^x where x represents the year
Answers: 3
You know the right answer?
1.The graph shows an association between variables x and y. What is the type of association between...
Questions


Physics, 09.09.2020 22:01

English, 09.09.2020 22:01


Computers and Technology, 09.09.2020 22:01


Chemistry, 09.09.2020 22:01
English, 09.09.2020 22:01
English, 09.09.2020 22:01
Mathematics, 09.09.2020 22:01
Spanish, 09.09.2020 22:01


