subject
Mathematics, 06.05.2021 07:00 zay179

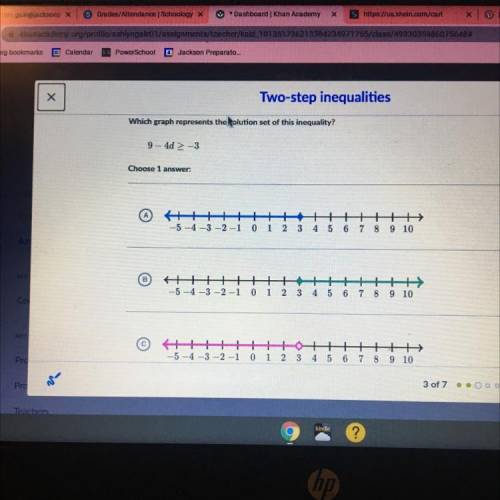
Which graph represents the solution set of this inequality? 9.-42 -3
Choose 1
202
Col
A
-5-4-3-2-1
++ + + +++
1 2 3 4 5 6 7 8 910
0
As
B
HH
-5 -4 -3 -2 -1
1
4 5 6 7 8 9 10
0 1
2
3
Col
MY
-5 -4 -3 -2 -1 0 1 2 3
Pro
6 7 8 9 10


Which graph represents the solution set of this inequality?

9.-42 -3
Choose 1 
202
Col
A
-

ansver
Answers: 2

Another question on Mathematics

question
Mathematics, 21.06.2019 14:30
Aparking lot is to be 400 feet wide and 370 feet deep. how many standard-sized cars fit in this lot considering a double-loaded (w4) two way traffic set up, an angle of 90° and a sw of 9’ 0’’? (do not consider handicapped parking spaces, and consider 15’ for turning aisles). show your work.
Answers: 2
question
Mathematics, 21.06.2019 18:30
The lengths of two sides of a right triangle are given. find the length of the third side. round to the nearest tenth if necessary. a) y = 12/5x + 39/5 b) y = 5/12x + 5/39 c) y = 12/5x - 39/5 d) y = 5/12x - 5/39
Answers: 2
question
Mathematics, 21.06.2019 21:30
Money off coupons have been circulated to 300 households. only 2/5 of these were redeemed (used) in the local supermarket to get a free shampoo. what fraction of coupons were unused? (ps: write how you got the answer)
Answers: 1
question
Mathematics, 21.06.2019 23:30
Find the arc length of the semicircle. 7the grade
Answers: 1
You know the right answer?
Which graph represents the solution set of this inequality? 9.-42 -3
Choose 1
202
Questions
Questions on the website: 13722360