
Mathematics, 06.05.2021 19:10 superkitty003
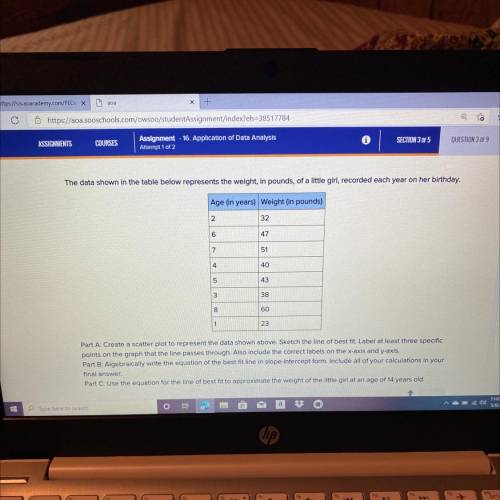
The data shown in the table below represents the weight, in pounds, of a little girl, recorded each year on her birthday.
Age (in years) Weight (in pounds)
2
32
6
47
7
51
4
40
5
43
3
38
8
60
1
23
Part A: Create a scatter plot to represent the data shown above. Sketch the line of best fit. Label at least three specific
points on the graph that the line passes through. Also include the correct labels on the x-axis and y-axis.
Part B: Algebraically write the equation of the best fit line in slope-intercept form. Include all of your calculations in your
final answer
Part C: Use the equation for the line of best fit to approximate the weight of the little girl at an age of 14 years old.

Answers: 1


Another question on Mathematics
Mathematics, 21.06.2019 16:00
Determine the relationship of ab and cd given the following points
Answers: 2
Mathematics, 21.06.2019 23:50
What is the cube root of -1,000p^12q3? -10p^4 -10p^4q 10p^4 10p^4q
Answers: 3
Mathematics, 22.06.2019 00:30
L|| m if m? 1=125 and m? 7=50 then m? 5= 5 55 75 105 next question ask for turn it in © 2014 glynlyon, inc. all rights reserved. terms of use
Answers: 3
You know the right answer?
The data shown in the table below represents the weight, in pounds, of a little girl, recorded each...
Questions

Chemistry, 25.03.2021 19:50

History, 25.03.2021 19:50


Geography, 25.03.2021 19:50


English, 25.03.2021 19:50

Social Studies, 25.03.2021 19:50
Mathematics, 25.03.2021 19:50

Mathematics, 25.03.2021 19:50
Biology, 25.03.2021 19:50


