
Mathematics, 07.05.2021 14:00 ciya12
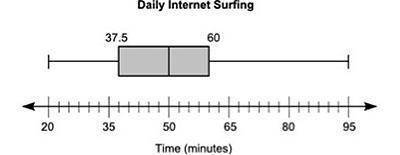
The box plot below shows the total amount of time, in minutes, the students of a class surf the Internet every day: A box plot is shown. The left-most point on the plot is 20 and the right-most point is 95. The box is labeled 37.5 on the left edge and 60 on the right edge. A vertical line is drawn inside the rectangle at the point 50. Part B: Calculate the interquartile range of the data, and explain in a sentence or two what it represents.

Answers: 1


Another question on Mathematics
Mathematics, 21.06.2019 19:30
Select the margin of error that corresponds to the sample mean that corresponds to each population: a population mean of 25, a standard deviation of 2.5, and margin of error of 5%
Answers: 2
Mathematics, 21.06.2019 21:30
50 people men and women were asked if they watched at least one sport on tv. 20 of the people surveyed are women, but only 9 of them watch at least one sport on tv. 16 of the men watch at least one sport on tv. make a a two-way table and a relative frequency table to represent the data.
Answers: 3
Mathematics, 21.06.2019 22:00
What value is a discontinuity of x squared plus 8 x plus 4, all over x squared minus x minus 6?
Answers: 2
Mathematics, 21.06.2019 22:50
If set d is not the empty set but is a subset of set e, then which of the following is true? d ∩ e = d d ∩ e = e d ∩ e = ∅
Answers: 1
You know the right answer?
The box plot below shows the total amount of time, in minutes, the students of a class surf the Inte...
Questions
Mathematics, 05.11.2020 22:00
Mathematics, 05.11.2020 22:00


Social Studies, 05.11.2020 22:00


SAT, 05.11.2020 22:00
Mathematics, 05.11.2020 22:00


Mathematics, 05.11.2020 22:00
Mathematics, 05.11.2020 22:00
Mathematics, 05.11.2020 22:00
Mathematics, 05.11.2020 22:00
Mathematics, 05.11.2020 22:00
Mathematics, 05.11.2020 22:00

English, 05.11.2020 22:00
Chemistry, 05.11.2020 22:00


