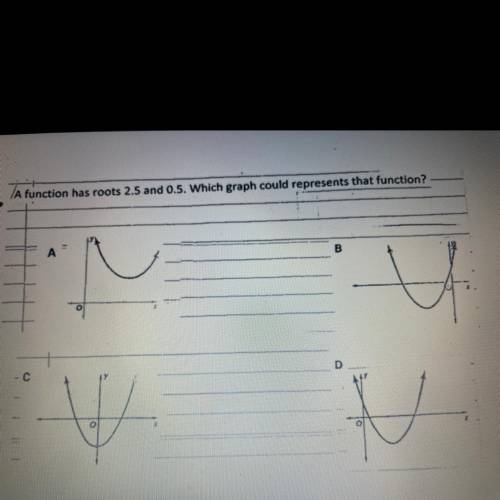
A function has roots 2.5 and 0.5. Which graph could represents that function?
...

Mathematics, 07.05.2021 19:10 christopherschool04
A function has roots 2.5 and 0.5. Which graph could represents that function?


Answers: 3


Another question on Mathematics

Mathematics, 21.06.2019 17:00
Why did the ice arena get so hot after the big game (this is math related google it to find the paper
Answers: 2

Mathematics, 21.06.2019 18:30
Given the equation f(x)=a(b)x where the initial value is 40 and the growth rate is 20% what is f(4)
Answers: 1


Mathematics, 22.06.2019 03:00
A. the probability that a product is defective is 0.1. what is the probability that there will be 1 or less defective products out of the next 8 produced products b.the expected number of imperfections in the coating nylon for parachutes is 6 per 100 yards. what is the probability of finding 12 or fewer imperfections in 260 yards c.in a lot of 54 products there are 9 defective products. calculate the probability that not more than 1 is defective from a random sample of 17 products.
Answers: 1
You know the right answer?
Questions

English, 02.04.2020 23:57

Arts, 02.04.2020 23:57

History, 02.04.2020 23:57

Mathematics, 02.04.2020 23:57

Mathematics, 02.04.2020 23:57

Geography, 02.04.2020 23:57


Physics, 02.04.2020 23:57


Health, 02.04.2020 23:57

Mathematics, 02.04.2020 23:57


Law, 02.04.2020 23:57


English, 02.04.2020 23:58

Biology, 02.04.2020 23:58


History, 02.04.2020 23:58


Mathematics, 02.04.2020 23:58


