
Mathematics, 07.05.2021 21:00 hokamidat
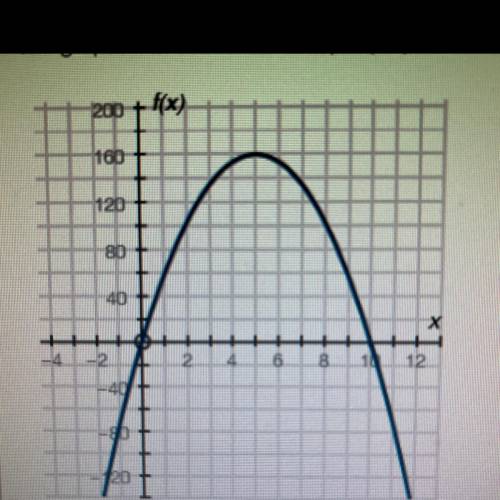
The graph below shows a company’s profit f(x), in dollars, depending on the price of pencils x, in dollars, being sold by the company:
Part A: What do the x-intercepts and maximum value of the graph represent? What are the intervals where the function is increasing and decreasing, and what do they represent about the sale and profit?
Part B: What is an approximate average rate of change of the graph from x = 2 to x = 5, and what does this rate represent?

Answers: 3


Another question on Mathematics
Mathematics, 21.06.2019 19:30
Celeste wants to have her hair cut and permed and also go to lunch. she knows she will need $50. the perm cost twice as much as her haircut and she needs $5 for lunch. how much does the perm cost?
Answers: 1
Mathematics, 22.06.2019 02:00
During how many months was the difference between the number of days with homework and with no homework greater than 6?
Answers: 1
Mathematics, 22.06.2019 02:30
Match each set of points with the quadratic function whose graph passes through those points
Answers: 1
You know the right answer?
The graph below shows a company’s profit f(x), in dollars, depending on the price of pencils x, in d...
Questions


History, 09.04.2020 01:02

Mathematics, 09.04.2020 01:02
History, 09.04.2020 01:02
Physics, 09.04.2020 01:02


Chemistry, 09.04.2020 01:03
Mathematics, 09.04.2020 01:03
Mathematics, 09.04.2020 01:04

Biology, 09.04.2020 01:04
Mathematics, 09.04.2020 01:04


