
Mathematics, 10.05.2021 18:30 xojade
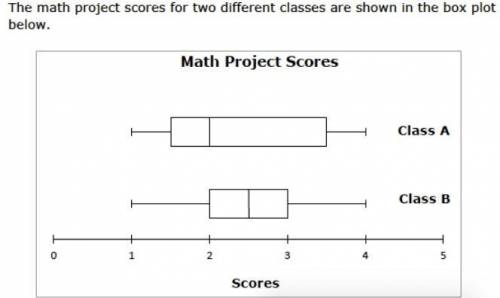
The math project scores for two different classes are shown in the box plot below.
(the picture)
Which statement about Class A and Class B math project scores is NOT supported by the graph?
A) The range of scores for both classes is 3.
B) The interquartile range for Class A is greater than the interquartile range for Class B.
C) The interquartile range for Class B is 2.
D) The median score for Class B is 0.5 greater than the median score for Class A.

Answers: 3


Another question on Mathematics
Mathematics, 21.06.2019 18:00
Solve this and show you’re work step by step ! -5 3/4+3h< 9 1/4 -
Answers: 1
Mathematics, 21.06.2019 21:00
Circle a has a diameter of 7 inches, a circumference of 21.98 inches, and an area of 38.465 square inches. the diameter of circle b is 6 inches, the circumference is 18.84 inches, and the area is 28.26 square inches. part a: using the formula for circumference, solve for the value of pi for each circle. (4 points) part b: use the formula for area and solve for the value of pi for each circle. (4 points)
Answers: 2
Mathematics, 21.06.2019 23:00
Solve the system of equations using the substitution method. {y=−3x+7x=−2y−16 enter your answers in the boxes.
Answers: 1
You know the right answer?
The math project scores for two different classes are shown in the box plot below.
(the picture)
Questions

Chemistry, 21.04.2020 04:22
Chemistry, 21.04.2020 04:22


History, 21.04.2020 04:22

Geography, 21.04.2020 04:22

History, 21.04.2020 04:22
Mathematics, 21.04.2020 04:22
Mathematics, 21.04.2020 04:22

Mathematics, 21.04.2020 04:22


