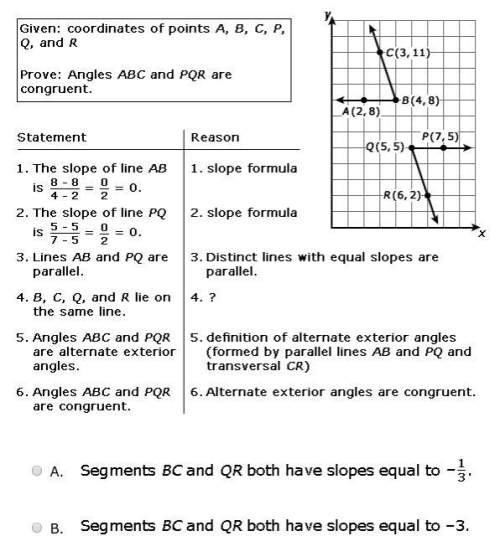
6
The age ranges of employees at a company are listed in the graph below. A
total of 168 emp...

Mathematics, 10.05.2021 20:20 mimibear2932
6
The age ranges of employees at a company are listed in the graph below. A
total of 168 employees are represented in the graph.
Employee Ages
50
40
30
Frequency
20
10
0
20 - 30
31 - 40
41 - 50
51 - 60
61 - 70
71-80
Age (years)
Which statement accurately describes the data represented in the graph?

Answers: 3


Another question on Mathematics
Mathematics, 20.06.2019 18:04
Find four consecutive odd numbers which add to 64. give the numbers smallest to largest
Answers: 3
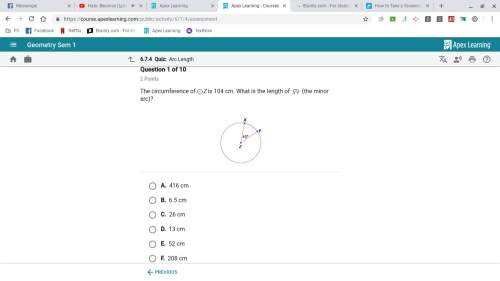
Mathematics, 22.06.2019 03:00
Let f(x) = 1/x^2 (a) use the definition of the derivatve to find f'(x). (b) find the equation of the tangent line at x=2
Answers: 2
Mathematics, 22.06.2019 04:00
The label on a can of lemonade gives the volume as 12 fl 0z or 355ml verify that these two measurements are nearly equivalent
Answers: 1
You know the right answer?
Questions
Mathematics, 27.10.2020 01:00


English, 27.10.2020 01:00
Mathematics, 27.10.2020 01:00

Medicine, 27.10.2020 01:00
Mathematics, 27.10.2020 01:00
Mathematics, 27.10.2020 01:00


