
Mathematics, 10.05.2021 22:50 carolinekeogh3250
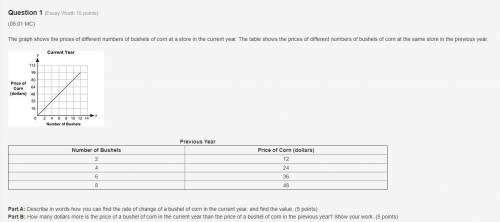
The graph shows the prices of different numbers of bushels of corn at a store in the current year. The table shows the prices of different numbers of bushels of corn at the same store in the previous year.
A graph shows Number of Bushels on x-axis and Price of Corn in dollars on y-axis. The x-axis scale is shown from 0 to 14 at increments of 2, and the y-axis scale is shown from 0 to 112 at increments of 16. A straight line joins the ordered pairs 2, 16 and 4, 32 and 6, 48 and 8, 64 and 10, 80 and 12, 96.
Previous Year
Number of Bushels
Price of Corn (dollars)
2
12
4
24
6
36
8
48
Part A: Describe in words how you can find the rate of change of a bushel of corn in the current year, and find the value. (5 points)
Part B: How many dollars more is the price of a bushel of corn in the current year than the price of a bushel of corn in the previous year? Show your work. (5 points)

Answers: 1


Another question on Mathematics
Mathematics, 21.06.2019 17:00
Ben is three times as old as samantha, who is two years older than half of michel's age. if michel is 12. how old is ben?
Answers: 1
Mathematics, 21.06.2019 19:00
The test scores of 32 students are listed below. construct a boxplot for the data set and include the values of the 5-number summary. 32 37 41 44 46 48 53 55 57 57 59 63 65 66 68 69 70 71 74 74 75 77 78 79 81 82 83 86 89 92 95 99
Answers: 1
Mathematics, 21.06.2019 19:30
If 2(a^2+b^2)=(a+b)^2 then, > a+b=0, > ab=0, > a=b, > 2a=b
Answers: 1
Mathematics, 21.06.2019 19:30
Need now max recorded the heights of 500 male humans. he found that the heights were normally distributed around a mean of 177 centimeters. which statements about max’s data must be true? a) the median of max’s data is 250 b) more than half of the data points max recorded were 177 centimeters. c) a data point chosen at random is as likely to be above the mean as it is to be below the mean. d) every height within three standard deviations of the mean is equally likely to be chosen if a data point is selected at random.
Answers: 1
You know the right answer?
The graph shows the prices of different numbers of bushels of corn at a store in the current year. T...
Questions


Advanced Placement (AP), 07.12.2020 17:00
Mathematics, 07.12.2020 17:00

Mathematics, 07.12.2020 17:00
Mathematics, 07.12.2020 17:00
Mathematics, 07.12.2020 17:00
History, 07.12.2020 17:00
Health, 07.12.2020 17:00
Advanced Placement (AP), 07.12.2020 17:00


