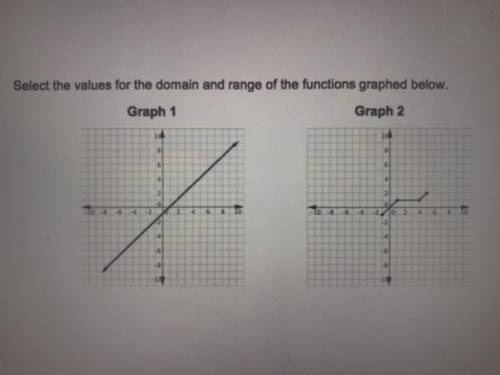
Select the values for the domain and range of the functions graphed below.
Graph 1
Graph...

Mathematics, 11.05.2021 04:00 krystalhurst97
Select the values for the domain and range of the functions graphed below.
Graph 1
Graph 2


Answers: 2


Another question on Mathematics

Mathematics, 21.06.2019 16:00
Part one: measurements 1. measure your own height and arm span (from finger-tip to finger-tip) in inches. you will likely need some from a parent, guardian, or sibling to get accurate measurements. record your measurements on the "data record" document. use the "data record" to you complete part two of this project. name relationship to student x height in inches y arm span in inches archie dad 72 72 ginelle mom 65 66 sarah sister 64 65 meleah sister 66 3/4 67 rachel sister 53 1/2 53 emily auntie 66 1/2 66 hannah myself 66 1/2 69 part two: representation of data with plots 1. using graphing software of your choice, create a scatter plot of your data. predict the line of best fit, and sketch it on your graph. part three: the line of best fit include your scatter plot and the answers to the following questions in your word processing document 1. 1. which variable did you plot on the x-axis, and which variable did you plot on the y-axis? explain why you assigned the variables in that way. 2. write the equation of the line of best fit using the slope-intercept formula $y = mx + b$. show all your work, including the points used to determine the slope and how the equation was determined. 3. what does the slope of the line represent within the context of your graph? what does the y-intercept represent? 5. use the line of best fit to you to describe the data correlation.
Answers: 2

Mathematics, 21.06.2019 17:00
You and three friends will be going out to eat at your favorite restaurant! each of you will order three items of your choice. you will also need to leave a tip. if you split the bill evenly among all four of you, how much will each person need to contribute? locate a menu for your favorite restaurant and pick three items for yourself and each friend. list the restaurant name, items, and prices in a table like the one below. in the column labeled subtotal, determine the cost of each person’s order. the customary tip is 20% of the total bill. in the column labeled tip, calculate the amount of tip each person should leave. in the column labeled total bill, determine the total of each person’s order, including the tip. restaurant name: names item 1 price item 2 price item 3 price subtotal tip total bill your name friend #1 friend #2 friend #3 part 2: questions answer the following questions, showing all work: what is the total cost of the entire bill (all four meals), including tip? write an expression using fractions to show how to determine the amount that each person will pay. then calculate each person's contributions showing all steps in long division. if each person paid an equal amount, who would save the most money? explain your reasoning using at least two complete sentences.
Answers: 2

Mathematics, 21.06.2019 18:10
The number of branches on a tree demonstrates the fibonacci sequence. how many branches would there be on the next two levels of this tree? 13 | | | m branches
Answers: 3

Mathematics, 21.06.2019 19:00
15 points! write the slope-intercept form of the equation of the line through the given point with the given slope. use y-y = m(x-x) to solve. through (2,5) slope= undefined
Answers: 2
You know the right answer?
Questions


Biology, 20.01.2021 06:40


Business, 20.01.2021 06:40

Physics, 20.01.2021 06:40


Mathematics, 20.01.2021 06:40

Mathematics, 20.01.2021 06:40

Chemistry, 20.01.2021 06:40


Mathematics, 20.01.2021 06:40


Mathematics, 20.01.2021 06:40


History, 20.01.2021 06:40

Mathematics, 20.01.2021 06:40

Mathematics, 20.01.2021 06:40

Mathematics, 20.01.2021 06:40


