subject
Mathematics, 11.05.2021 07:30 NathanaelLopez

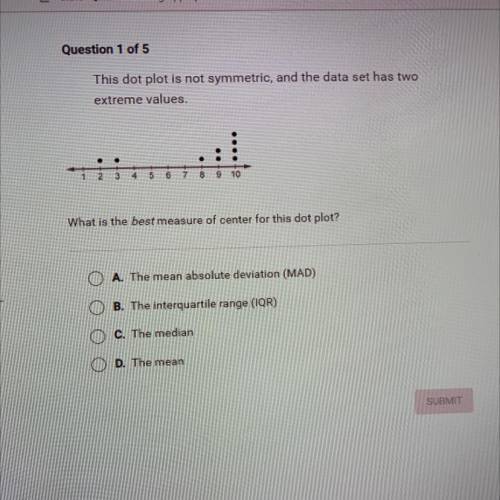
This dot plot is not symmetric, and the data set has two extreme values.
.
2
3
8
What is the best measure of center for this dot plot?
O A. The mean absolute deviation (MAD)
B. The interquartile range (IQR)
C. The median
D. The mean


This dot plot is not symmetric, and the data set has two

extreme values.
.
2
3
8
What is the best

ansver
Answers: 1

Another question on Mathematics

question
Mathematics, 21.06.2019 23:40
From the top of a tree a bird looks down on a field mouse at an angle of depression of 50°. if the field mouse is 40 meters from the base of the tree, find the vertical distance from the ground to the bird's eyes.
Answers: 1
question
Mathematics, 22.06.2019 00:00
Me with this assignment ! i only partially understand, so explain. also it's a work sample. at the championship bike race, steve and paula were fighting for first place. steve was 175 feet ahead of paula and had only 300 feet left to go. he was very tired and was going only 9 feet per second. paula was desperate to catch up and was going 15 feet per second. who won the bike race and by how far did she/he win?
Answers: 1
question
Mathematics, 22.06.2019 05:40
Rob is investigating the effects of font size on the number of words that fit on a page. he changes the font size on an essay and records the number of words on one page of the essay. the table shows his data. which equation represents the approximate line of best fit for data, where x represents font size and y represents the number of words on one page?
Answers: 3
question
Mathematics, 22.06.2019 06:00
Find the length cu. the triangles are similiar.
Answers: 1
You know the right answer?
This dot plot is not symmetric, and the data set has two extreme values.
.
2
3
Questions
question
Mathematics, 26.11.2019 05:31
question
Mathematics, 26.11.2019 05:31
question
Mathematics, 26.11.2019 05:31
question
Mathematics, 26.11.2019 05:31
Questions on the website: 13722367