What is the range of this data based on the dot plot?
Life Expectancy by State
74 76
78...

Mathematics, 11.05.2021 17:10 munozjosue258
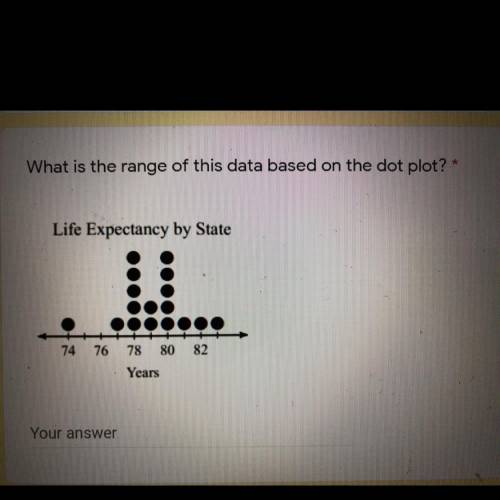
What is the range of this data based on the dot plot?
Life Expectancy by State
74 76
78 80 82
Years

Answers: 2


Another question on Mathematics
Mathematics, 21.06.2019 19:00
Abacteria population is tripling every hour. by what factor does the population change in 1/2 hour? select all that apply
Answers: 1
Mathematics, 21.06.2019 20:30
The function show two sisters' savings account and the rate at which they plan to deposit money
Answers: 3
You know the right answer?
Questions

Mathematics, 22.09.2019 14:30

History, 22.09.2019 14:30

Physics, 22.09.2019 14:30
Health, 22.09.2019 14:30

Physics, 22.09.2019 14:30

Chemistry, 22.09.2019 14:30

Business, 22.09.2019 14:30

Biology, 22.09.2019 14:30
Mathematics, 22.09.2019 14:30

Geography, 22.09.2019 14:30

Social Studies, 22.09.2019 14:30


