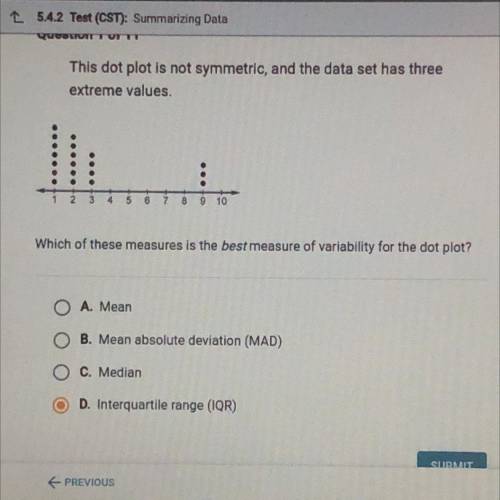
This dot plot is not symmetric, and the data set has three
extreme values
Which of thes...

Mathematics, 11.05.2021 18:50 manny2275
This dot plot is not symmetric, and the data set has three
extreme values
Which of these measures is the best measure of variability for the dot plot?
O A. Mean
B. Mean absolute deviation (MAD)
O c. Median
D. Interquartile range (IQR)

Answers: 3


Another question on Mathematics
Mathematics, 21.06.2019 15:30
Diane owes $387 to her brother. if she debits her bank account $161.25 a month to pay him back, how many months will it take her to pay off the debt?
Answers: 2
Mathematics, 21.06.2019 19:30
Tim's phone service charges $26.39 plus an additional $0.21 for each text message sent per month. if tim's phone bill was $31.64, which equation could be used to find how many text messages, x, tim sent last month?
Answers: 1
Mathematics, 21.06.2019 20:30
What is the axis of symmetry of the function f(x)=-(x+ 9)(x-21)
Answers: 2
Mathematics, 21.06.2019 21:30
Plz hurry evaluate the expression a+b where a=8 and b=19
Answers: 1
You know the right answer?
Questions

Mathematics, 16.12.2020 19:00
Mathematics, 16.12.2020 19:00
Mathematics, 16.12.2020 19:00

Advanced Placement (AP), 16.12.2020 19:00
Advanced Placement (AP), 16.12.2020 19:00

Mathematics, 16.12.2020 19:00
Mathematics, 16.12.2020 19:00
Mathematics, 16.12.2020 19:00

Computers and Technology, 16.12.2020 19:00

French, 16.12.2020 19:00

World Languages, 16.12.2020 19:00
Mathematics, 16.12.2020 19:00


