
Mathematics, 11.05.2021 20:50 dadnapper
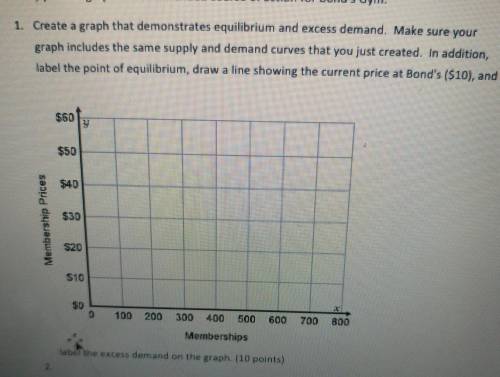
Create a graph that demonstrates equilibrium and excess demand. Make sure your graph includes the same supply and demand curves that you just created. In addition, label the point of equilibrium, draw a line showing the current price at Bond's ($10), and label the excess demand on the graph

Answers: 1


Another question on Mathematics
Mathematics, 21.06.2019 12:30
And explain how you got it so i can understand future problems : 3
Answers: 1
Mathematics, 21.06.2019 13:40
Use the normal approximation to the binomial distribution to answer this question. fifteen percent of all students at a large university are absent on mondays. if a random sample of 12 names is called on a monday, what is the probability that four students are absent?
Answers: 2
Mathematics, 21.06.2019 13:50
At a sand and gravel plant, sand is falling off a conveyor and onto a conical pile at a rate of 16 cubic feet per minute. the diameter of the base of the cone is approximately three times the altitude. at what rate is the height of the pile changing when the pile is 12 feet high? (hint: the formula for the volume of a cone is v = 1 3 πr2h.)
Answers: 3
Mathematics, 21.06.2019 16:00
You are measuring the dimensions of the floor in your bedroom because you are planning to buy new carpet. which unit of measure is the most appropriate to use in this situation?
Answers: 3
You know the right answer?
Create a graph that demonstrates equilibrium and excess demand. Make sure your graph includes the sa...
Questions


Mathematics, 25.02.2022 05:50

English, 25.02.2022 05:50
Mathematics, 25.02.2022 05:50

Physics, 25.02.2022 05:50
English, 25.02.2022 05:50
English, 25.02.2022 06:00

Social Studies, 25.02.2022 06:00

Social Studies, 25.02.2022 06:00

Business, 25.02.2022 06:00
Mathematics, 25.02.2022 06:00
English, 25.02.2022 06:00


