
Mathematics, 12.05.2021 01:10 khalilh1206
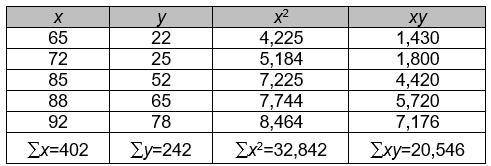
The table shows data from a stadium concession stand, representing average temperature (x) in degrees Fahrenheit and the number of popsicles sold (y).
Which regression equation correctly models the data?
y = 0.60x – 17
y = 0.60x – 0.16
y = 2.09x – 114
y = 2.09x – 120

Answers: 1


Another question on Mathematics
Mathematics, 21.06.2019 15:20
Beth took out a $20,000 loan for college she is borrowing money from two banks. bank a charges an interest rate of 8.5% bank b charges and interest rate of 10.5% after one year alice owes $1860 in interest how much money did she borrow from bank a
Answers: 3
Mathematics, 21.06.2019 16:00
In the 30-60-90 triangle below side s has a length of and side r has a length
Answers: 2
Mathematics, 21.06.2019 17:40
How can the correlation in the scatter plot graph below best be described? positive correlation negative correlation both positive and negative no correlation
Answers: 1
Mathematics, 21.06.2019 19:00
Which of the expressions (on the photo document i inserted) together represent all solutions to the following equation? 8cos(12x)+4=-4 *the answer should be in degrees.* > i would like for someone to explain the process to find the solutions for this.
Answers: 2
You know the right answer?
The table shows data from a stadium concession stand, representing average temperature (x) in degree...
Questions


History, 15.02.2020 00:34


