Which values should you plot to show a linear relationship?
Year
Log(population)
Popula...

Mathematics, 12.05.2021 01:50 ellareynolds2337
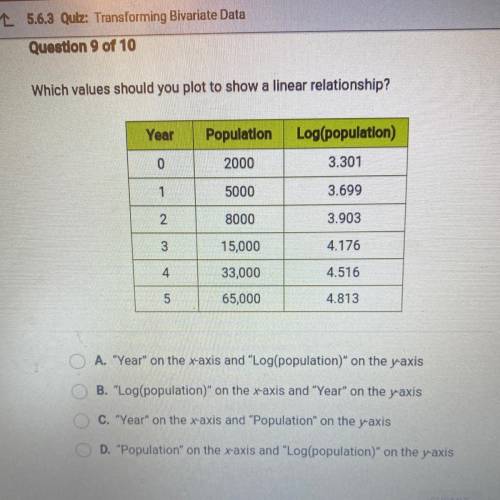
Which values should you plot to show a linear relationship?
Year
Log(population)
Population
2000
0
3.301
1
5000
3.699
2
8000
3.903
3
15,000
4.176
4
33,000
4.516
5
65,000
4.813
O A. "Year" on the x-axis and "Log(population)" on the yaxis
B. "Log(population)" on the x-axis and "Year" on the yaxis
C. "Year" on the x-axis and "Population" on the yaxis
D. "Population" on the x-axis and "Log(population)" on the y-axis

Answers: 3


Another question on Mathematics
Mathematics, 22.06.2019 01:30
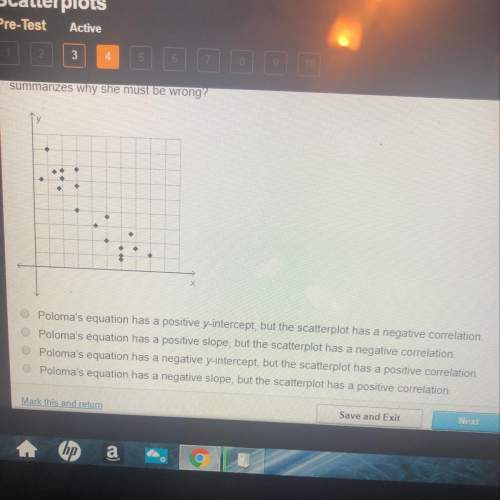
One side of a rectangle is 7 centimeters shorter than six times the other side. find the length of the longer side if we also know that the perimeter of the rectangle is 266 centimeters.
Answers: 2
Mathematics, 22.06.2019 02:20
The diagram shows a cuboid abcdefgh abcd is a square with area 25cm². find the volume of the cuboid.
Answers: 3
You know the right answer?
Questions


History, 05.09.2019 18:30

Mathematics, 05.09.2019 18:30

History, 05.09.2019 18:30


Mathematics, 05.09.2019 18:30


Health, 05.09.2019 18:30


