
Mathematics, 12.05.2021 02:10 andy2461
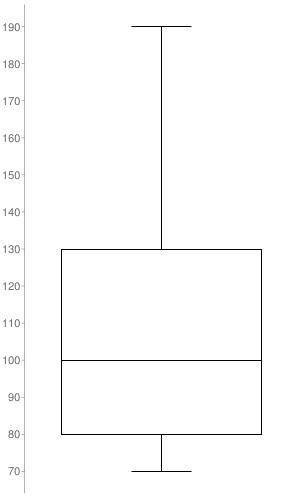
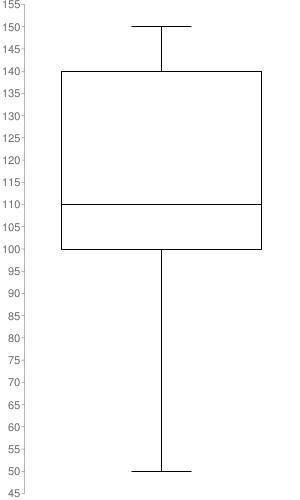
Two groups went bowling. Here are the scores from each group.
Group A: 80, 100, 190, 110, 70, 90, 130
Group B: 50, 110, 100, 120, 107, 140, 150
70
80
190
50 60
90 100 110 120 130 140 150 160 170 180
score in points
1. Construct two box plots, one for the data in each group.
2. Which group shows greater variability? Explain how you know.

Answers: 2


Another question on Mathematics
Mathematics, 21.06.2019 19:00
Abag of jelly beans contain 13 pink, green, 20 yellow, 10 black, 7 red, and 11 orange jelly beans. approximately what percent of the jelly beans are pink and yellow?
Answers: 1
Mathematics, 21.06.2019 19:50
98 point question what is the record for most points in one
Answers: 2
Mathematics, 21.06.2019 21:00
The radius of a sphere is 3 inches. which represents the volume of the sphere?
Answers: 1
Mathematics, 21.06.2019 22:00
Sara has been reading about different types of financial grants, including federal pell grants, academic competitiveness grants, smart grants, and teach grants. which statement about these grants is true? filling out a fafsa will not her apply for these grants. she will not have to pay back any funds she receives from these grants. these grants only go to students with less than a 3.0 gpa. she will have to pay back all the funds she receives from these grants.
Answers: 2
You know the right answer?
Two groups went bowling. Here are the scores from each group.
Group A: 80, 100, 190, 110, 70, 90, 1...
Questions
Mathematics, 13.04.2020 01:29

English, 13.04.2020 01:29
Mathematics, 13.04.2020 01:29

Social Studies, 13.04.2020 01:29

History, 13.04.2020 01:29


Mathematics, 13.04.2020 01:29
Biology, 13.04.2020 01:29
Mathematics, 13.04.2020 01:29
Chemistry, 13.04.2020 01:29
Mathematics, 13.04.2020 01:29
English, 13.04.2020 01:29


