
Mathematics, 12.05.2021 03:10 AyeSmoky
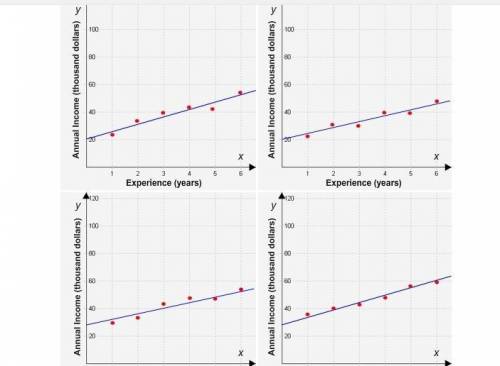
Select the correct graph. When David first got a job, his annual income was $20,000. He worked hard and got more experience. After 8 years, he realized that his average increase in pay was about $4,000 every year. Which scatter plot represents this situation?

Answers: 2


Another question on Mathematics
Mathematics, 21.06.2019 20:00
Afamily has five members. a mom, a dad, two sisters, & a brother. the family lines up single file. what is the probabillity that the mom is at the front of the line
Answers: 1
Mathematics, 21.06.2019 21:00
Deepak plotted these points on the number line. point a: –0.3 point b: – 3 4 point c: – 11 4 point d: –0.7 which point did he plot incorrectly?
Answers: 2
Mathematics, 21.06.2019 21:00
Hurry if the population of of an ant hill doubles every 10 days and there are currently 100 ants living in the ant hill what will the ant population be in 20 days
Answers: 2
You know the right answer?
Select the correct graph.
When David first got a job, his annual income was $20,000. He worked hard...
Questions

Mathematics, 29.04.2021 07:50

Arts, 29.04.2021 07:50


Chemistry, 29.04.2021 07:50

Mathematics, 29.04.2021 07:50
Mathematics, 29.04.2021 07:50
Mathematics, 29.04.2021 07:50
Mathematics, 29.04.2021 07:50

Computers and Technology, 29.04.2021 07:50
History, 29.04.2021 07:50

Physics, 29.04.2021 07:50


