Mathematics, 12.05.2021 15:50 khloenm309
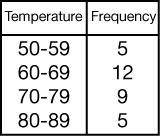
The following frequency table shows the observed high temperatures in Buffalo, New York, in May 2007.
Which interval contains the median temperature?
A.)50 - 59
B.)60 - 69
C.)70 - 79
D.)80 - 89


Answers: 1


Another question on Mathematics

Mathematics, 21.06.2019 19:30
Jane moves from a house with 71 square feet of closet space to an apartment with 45.44 square feet of closet space. what is the percentage decrease of jane’s closet space?
Answers: 1

Mathematics, 21.06.2019 23:00
Solve for x: 5/3 x = 20/21 it's fraction. remember to simplify your fraction
Answers: 2

Mathematics, 22.06.2019 00:00
The cost of a taxi ride includes an initial charge of $2.00. if a 5km ride cost $6.00 and a 10km ride cost $10.00, determine the cost of a 15km ride.
Answers: 1

Mathematics, 22.06.2019 01:30
The unpaid balance on a mastercard charge was $1,056.23. during the month, payments of $300 and $250 were made and charges of $425 and $274.16 were added. if the finance charge is 1.2% per month on the unpaid balance, find the new balance at the end of the month. $1,205.39 $1,218.06 $918.06 $1,768.06
Answers: 2
You know the right answer?
The following frequency table shows the observed high temperatures in Buffalo, New York, in May 2007...
Questions

Social Studies, 16.11.2020 07:50


Mathematics, 16.11.2020 07:50


Health, 16.11.2020 07:50


History, 16.11.2020 07:50

English, 16.11.2020 07:50

Mathematics, 16.11.2020 07:50


Biology, 16.11.2020 07:50


Biology, 16.11.2020 07:50

English, 16.11.2020 07:50

Mathematics, 16.11.2020 07:50


Mathematics, 16.11.2020 07:50


