1. The table shows the minimum wage rates for the United States during different years.
Year
...

Mathematics, 12.05.2021 17:20 madgiemiller2309
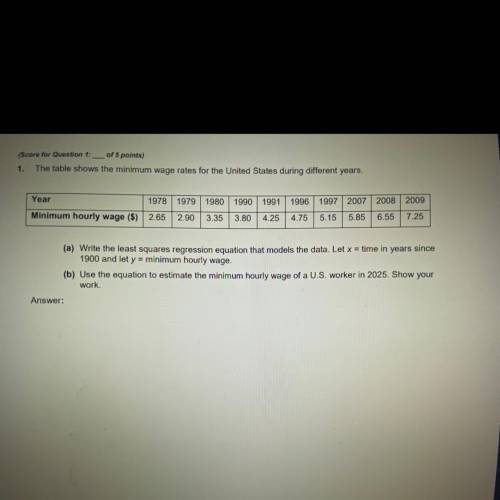
1. The table shows the minimum wage rates for the United States during different years.
Year
1978 1979 1980 1990 1991 1996 1997 2007 2008 2009
Minimum hourly wage ($) 2.65 2.90 3.35 3.80 4.25 4.75 5.15 5.85 6.55 7.25
(a) Write the least squares regression equation that models the data. Let x = time in years since
1900 and let y = minimum hourly wage.
(b) Use the equation to estimate the minimum hourly wage of a U. S. worker in 2025. Show your
work.

Answers: 3


Another question on Mathematics
Mathematics, 21.06.2019 22:30
Select all of the following expressions that are equal to 2.5.
Answers: 3
Mathematics, 22.06.2019 01:10
Pamela has a 30-year, 5.75% mortgage on her $250,000 home. she has been paying on it for 5 years, and has recently hit some financial trouble. if her lender agreed to lower the interest rate on her $231,905.47 balance to 5.5%, what will her new payment be for the remainder of the loan?
Answers: 2
You know the right answer?
Questions

Mathematics, 28.05.2021 01:00

Business, 28.05.2021 01:00


Medicine, 28.05.2021 01:00

English, 28.05.2021 01:00
Mathematics, 28.05.2021 01:00
Health, 28.05.2021 01:00
Mathematics, 28.05.2021 01:00
English, 28.05.2021 01:00


