
Mathematics, 12.05.2021 17:30 merrickrittany
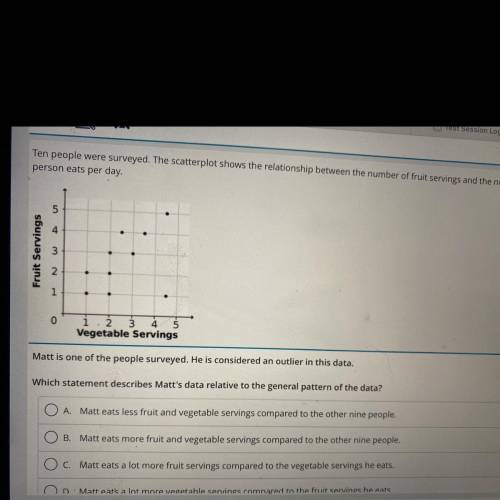
Ten people were surveyed. The scatterplot shows the relationship between the number of fruit servings and the number of vegetable servings each
person eats per day.
4
Fruit Servings
0
4
Vegetable Servings
Matt is one of the people surveyed. He is considered an outlier in this data.
Which statement describes Matt's data relative to the general pattern of the data?

Answers: 1


Another question on Mathematics
Mathematics, 21.06.2019 12:30
Given f(x) = 17-x^2what is the average rate of change in f(x) over the interval [1, 5]?
Answers: 2
Mathematics, 21.06.2019 16:00
On saturday morning, calls arrive at ticketmaster at a rate of 108 calls per hour. what is the probability of fewer than three calls in a randomly chosen minute?
Answers: 1
Mathematics, 21.06.2019 20:00
The function f(x) = 14,600(1.1)* represents the population of a town x years after it was established. what was the original population of the town?
Answers: 1
You know the right answer?
Ten people were surveyed. The scatterplot shows the relationship between the number of fruit serving...
Questions

Mathematics, 20.09.2020 14:01

Physics, 20.09.2020 14:01
Mathematics, 20.09.2020 14:01


Computers and Technology, 20.09.2020 14:01
Mathematics, 20.09.2020 14:01

Health, 20.09.2020 14:01
Mathematics, 20.09.2020 14:01

Advanced Placement (AP), 20.09.2020 14:01
English, 20.09.2020 14:01

Chemistry, 20.09.2020 14:01


