
Mathematics, 12.05.2021 20:20 jnsebastian2002
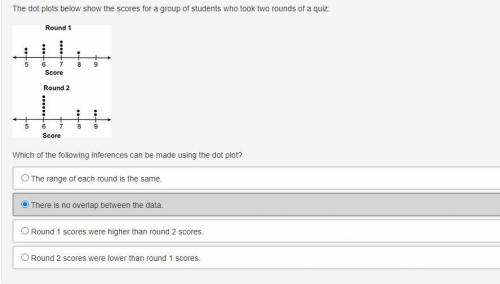
The dot plots below show the scores for a group of students who took two rounds of a quiz:
Which of the following inferences can be made using the dot plot?
The range of each round is the same.
There is no overlap between the data.
Round 1 scores were higher than round 2 scores.
Round 2 scores were lower than round 1 scores.

Answers: 3


Another question on Mathematics
Mathematics, 21.06.2019 16:30
Translate this phrase into an algebraic expression. 21 more than twice goran's savings use the variable g to represent goran's savings. need to know fast.
Answers: 1
Mathematics, 21.06.2019 22:30
We have 339 ounces of jam to be divided up equally for 12 people how muny ounces will each person get
Answers: 1
Mathematics, 22.06.2019 02:00
16x^2-16x=5 solve the equation by completing the square
Answers: 3
You know the right answer?
The dot plots below show the scores for a group of students who took two rounds of a quiz:
Which of...
Questions
Mathematics, 08.12.2021 18:20


Biology, 08.12.2021 18:20


Advanced Placement (AP), 08.12.2021 18:20

Biology, 08.12.2021 18:20

Physics, 08.12.2021 18:20
SAT, 08.12.2021 18:20

History, 08.12.2021 18:20
Mathematics, 08.12.2021 18:20
Mathematics, 08.12.2021 18:20


