
Mathematics, 12.05.2021 23:50 19colemankl
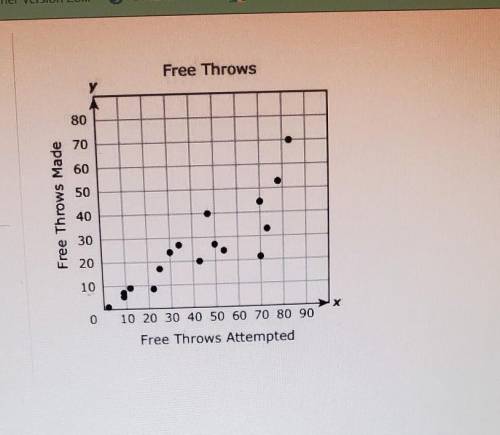
The scatterplot shows the number of free throws that different basketball players attempted and the number that each player made. Based on the trend in the data, approximately how many free throws would a player be expected to make if he attempted 60 free throws? Select one:
O35
O 60
O 50
O 25

Answers: 1


Another question on Mathematics
Mathematics, 21.06.2019 14:30
In the image, point a marks the center of the circle. which two lengths must form a ratio of 1 : 2? (options are in the images since thought they were harmful phrases)
Answers: 1
Mathematics, 21.06.2019 14:30
Will mark brainliest with 20 points! the table shows how far object 1 traveled as a function of time. *time (seconds) - 2 4 6 8 *distance traveled (feet) - 18 36 54 72 the equation shows how far object 2 traveled in feet as a function of time in minutes. *f(x) = 10x which object traveled at a faster speed? justify your response.
Answers: 1
Mathematics, 21.06.2019 15:20
Which function is increasing? o a. f(x)=(1/15)* o b. f(x)= (0.5)* o c. f(x)=(1/5)* o d. f(x) = 5*
Answers: 1
Mathematics, 21.06.2019 22:20
Which strategy is used by public health to reduce the incidence of food poisoning?
Answers: 2
You know the right answer?
The scatterplot shows the number of free throws that different basketball players attempted and the...
Questions

Computers and Technology, 27.02.2020 00:10


History, 27.02.2020 00:10


Physics, 27.02.2020 00:10

Biology, 27.02.2020 00:10

Health, 27.02.2020 00:10

Mathematics, 27.02.2020 00:10
Mathematics, 27.02.2020 00:11
Mathematics, 27.02.2020 00:11


