
Mathematics, 13.05.2021 01:00 chuyyoshy092714
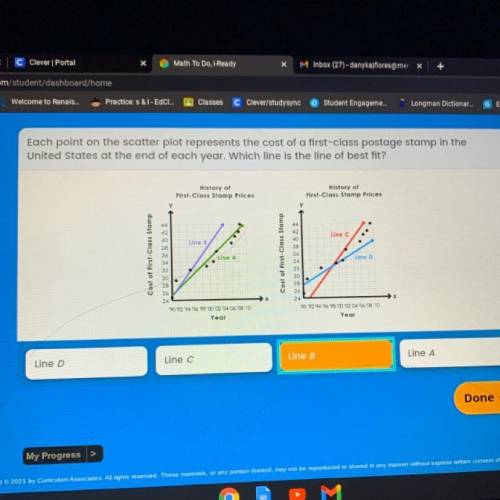
Each point on the scatter plot represents the cost of a first-class postage stamp in the
United States at the end of each year. Which line is the line of best fit?
History of
First-Class Stamp Prices
History of
First-Class Stamp Prices
Line C
Line B
Cost of First-Class Stamp
Cost of First-Class Stamp
Line A
Line D
26
24
90 92 94 9698 00 02 04 06 08 10
Year
90 92 94 96 98 00 02 04 06 08 10
Year
Line C
Line B
Line D
Line A

Answers: 2


Another question on Mathematics
Mathematics, 21.06.2019 17:30
What is the equation of a line passing through the point (6,1) and parallel to the line whose equation 3x=2y+4
Answers: 3
Mathematics, 21.06.2019 17:30
When a rectangle is dilated, how do the perimeter and area of the rectangle change?
Answers: 2
Mathematics, 21.06.2019 18:00
Given: and prove: what is the missing reason in the proof? given transitive property alternate interior angles theorem converse alternate interior angles theorem
Answers: 1
Mathematics, 21.06.2019 18:30
Identify the polynomial. a2b - cd3 a.monomial b.binomial c.trinomial d.four-term polynomial e.five-term polynomial
Answers: 1
You know the right answer?
Each point on the scatter plot represents the cost of a first-class postage stamp in the
United Sta...
Questions

Geography, 02.11.2019 04:31

History, 02.11.2019 04:31

Chemistry, 02.11.2019 04:31


World Languages, 02.11.2019 04:31
Mathematics, 02.11.2019 04:31
Mathematics, 02.11.2019 04:31

Physics, 02.11.2019 04:31
Mathematics, 02.11.2019 04:31
Chemistry, 02.11.2019 04:31
History, 02.11.2019 04:31


